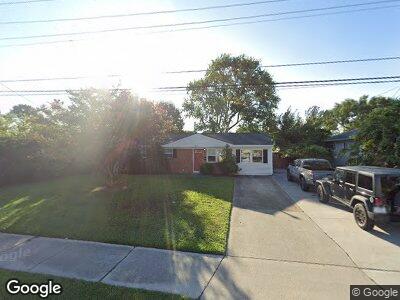
5021 Haygood Rd Virginia Beach, VA 23455
Aragona Village NeighborhoodEstimated Value: $273,000 - $349,000
3
Beds
2
Baths
1,200
Sq Ft
$263/Sq Ft
Est. Value
About This Home
This home is located at 5021 Haygood Rd, Virginia Beach, VA 23455 and is currently estimated at $315,144, approximately $262 per square foot. 5021 Haygood Rd is a home located in Virginia Beach City with nearby schools including Luxford Elementary School, Bayside 6th Grade Campus, and Bayside High School.
Ownership History
Date
Name
Owned For
Owner Type
Purchase Details
Closed on
Nov 23, 2016
Sold by
Jk Property Holdings Limited Partnership
Bought by
Portle Nathanael
Current Estimated Value
Home Financials for this Owner
Home Financials are based on the most recent Mortgage that was taken out on this home.
Original Mortgage
$183,664
Interest Rate
3.47%
Mortgage Type
VA
Purchase Details
Closed on
Mar 23, 2016
Sold by
Estaris Roy N
Bought by
Jk Property Holdings L P
Home Financials for this Owner
Home Financials are based on the most recent Mortgage that was taken out on this home.
Original Mortgage
$119,600
Interest Rate
3.65%
Mortgage Type
Credit Line Revolving
Purchase Details
Closed on
Aug 14, 2002
Sold by
Finch Thomas
Bought by
Estaris Roy
Home Financials for this Owner
Home Financials are based on the most recent Mortgage that was taken out on this home.
Original Mortgage
$86,400
Interest Rate
6.61%
Create a Home Valuation Report for This Property
The Home Valuation Report is an in-depth analysis detailing your home's value as well as a comparison with similar homes in the area
Home Values in the Area
Average Home Value in this Area
Purchase History
| Date | Buyer | Sale Price | Title Company |
|---|---|---|---|
| Portle Nathanael | $192,500 | Sun Title Inc | |
| Jk Property Holdings L P | $91,345 | Attorney | |
| Estaris Roy | $96,000 | -- |
Source: Public Records
Mortgage History
| Date | Status | Borrower | Loan Amount |
|---|---|---|---|
| Open | Pirtle Nathanael | $120,000 | |
| Closed | Pirtle Nathanael | $120,000 | |
| Closed | Pirtle Nathanel | $25,000 | |
| Closed | Portle Nathanael | $183,664 | |
| Previous Owner | Jk Property Holdings L P | $119,600 | |
| Previous Owner | Estaris Roy | $86,400 |
Source: Public Records
Tax History Compared to Growth
Tax History
| Year | Tax Paid | Tax Assessment Tax Assessment Total Assessment is a certain percentage of the fair market value that is determined by local assessors to be the total taxable value of land and additions on the property. | Land | Improvement |
|---|---|---|---|---|
| 2024 | $2,723 | $280,700 | $135,000 | $145,700 |
| 2023 | $2,608 | $263,400 | $120,000 | $143,400 |
| 2022 | $2,330 | $235,400 | $103,200 | $132,200 |
| 2021 | $2,062 | $208,300 | $79,400 | $128,900 |
| 2020 | $2,031 | $199,600 | $79,400 | $120,200 |
| 2019 | $2,003 | $196,300 | $75,900 | $120,400 |
| 2018 | $1,968 | $196,300 | $75,900 | $120,400 |
| 2017 | $1,968 | $196,300 | $75,900 | $120,400 |
| 2016 | $1,579 | $159,500 | $75,900 | $83,600 |
| 2015 | $1,543 | $155,900 | $75,900 | $80,000 |
| 2014 | $1,440 | $154,800 | $86,300 | $68,500 |
Source: Public Records
Map
Nearby Homes
- 5122 Cora Anne Ln
- 5011 Hawkins Mill Way
- 5013 Hawkins Mill Way
- 5009 Hawkins Mill Way
- 5015 Hawkins Mill Way
- 5005 Hawkins Mill Way
- 4993 Hawkins Mill Way
- 4997 Hawkins Mill Way
- 5117 Elsie Dr
- 5115 Elsie Dr
- 5001 Hawkins Mill Way
- 5205 Nuthall Dr Unit 102
- 4929 Haygood Rd
- 924 Southmoor Dr Unit 106
- 912 Southmoor Dr Unit 305
- 4929 Sullivan Blvd
- 4925 Sullivan Blvd
- 780 Olivieri Ln
- 4937 Whitman Ln
- 5212 Nuthall Dr Unit 206