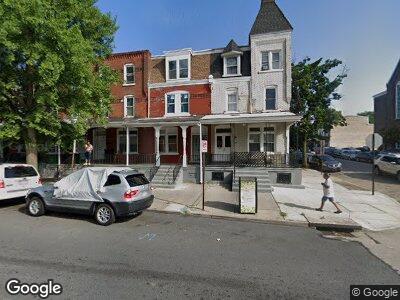
503 W Allen St Allentown, PA 18102
Center City NeighborhoodEstimated Value: $55,000 - $198,000
5
Beds
1
Bath
2,188
Sq Ft
$50/Sq Ft
Est. Value
About This Home
This home is located at 503 W Allen St, Allentown, PA 18102 and is currently estimated at $109,854, approximately $50 per square foot. 503 W Allen St is a home located in Lehigh County with nearby schools including Trexler Middle School, William Allen High School, and Roberto Clemente Elementary Charter School.
Ownership History
Date
Name
Owned For
Owner Type
Purchase Details
Closed on
Mar 7, 2024
Sold by
Endicon Inc
Bought by
Ayalas 8Th Rental Property Inc
Current Estimated Value
Purchase Details
Closed on
Sep 6, 2016
Sold by
Joseph Thomas and Thomas Annamma
Bought by
Endicon Inc
Home Financials for this Owner
Home Financials are based on the most recent Mortgage that was taken out on this home.
Original Mortgage
$375,000
Interest Rate
3.48%
Mortgage Type
Future Advance Clause Open End Mortgage
Purchase Details
Closed on
Aug 6, 1993
Sold by
Reach Ellen
Bought by
Joseph Thomas and Annamma Thomas
Purchase Details
Closed on
Apr 5, 1990
Sold by
Portee Merri and Ellen Reach
Bought by
Reach Ellen
Purchase Details
Closed on
Jul 21, 1987
Sold by
Torres William
Bought by
Portee Merri and Ellen Reach
Purchase Details
Closed on
Mar 29, 1984
Sold by
Ortiz Rafael and Ortiz Veronica
Bought by
Torres William
Purchase Details
Closed on
Jul 31, 1979
Bought by
Ortiz Rafael and Ortiz Veronica
Create a Home Valuation Report for This Property
The Home Valuation Report is an in-depth analysis detailing your home's value as well as a comparison with similar homes in the area
Home Values in the Area
Average Home Value in this Area
Purchase History
| Date | Buyer | Sale Price | Title Company |
|---|---|---|---|
| Ayalas 8Th Rental Property Inc | $50,000 | Hamilton Abstract | |
| Endicon Inc | -- | None Available | |
| Joseph Thomas | $35,000 | -- | |
| Reach Ellen | $31,900 | -- | |
| Portee Merri | $21,100 | -- | |
| Torres William | $20,000 | -- | |
| Ortiz Rafael | $17,900 | -- |
Source: Public Records
Mortgage History
| Date | Status | Borrower | Loan Amount |
|---|---|---|---|
| Previous Owner | Endicon Inc | $375,000 |
Source: Public Records
Tax History Compared to Growth
Tax History
| Year | Tax Paid | Tax Assessment Tax Assessment Total Assessment is a certain percentage of the fair market value that is determined by local assessors to be the total taxable value of land and additions on the property. | Land | Improvement |
|---|---|---|---|---|
| 2025 | $2,278 | $70,200 | $5,800 | $64,400 |
| 2024 | $2,278 | $70,200 | $5,800 | $64,400 |
| 2023 | $2,278 | $70,200 | $5,800 | $64,400 |
| 2022 | $2,198 | $70,200 | $64,400 | $5,800 |
| 2021 | $2,154 | $70,200 | $5,800 | $64,400 |
| 2020 | $2,098 | $70,200 | $5,800 | $64,400 |
| 2019 | $2,064 | $70,200 | $5,800 | $64,400 |
| 2018 | $1,927 | $70,200 | $5,800 | $64,400 |
| 2017 | $1,878 | $70,200 | $5,800 | $64,400 |
| 2016 | -- | $70,200 | $5,800 | $64,400 |
| 2015 | -- | $70,200 | $5,800 | $64,400 |
| 2014 | -- | $70,200 | $5,800 | $64,400 |
Source: Public Records
Map
Nearby Homes
- 448 W Allen St
- 615 W Allen St
- 454 W Liberty St
- 737 N 5th St
- 617 W Liberty St
- 508 N 4th St
- 533 N 4th St
- 643 N 4th St
- 419 N 6th St
- 392 W Tilghman St
- 742 N 4th St
- 395 W Liberty St
- 448 W Gordon St
- 458 N Jordan St Unit Lot 20
- 727 N 7th St
- 419 N 4th St
- 456 N Jordan St Unit Lot 19
- 701 N Jordan St
- 348 N 6th St
- 436 N Jordan St