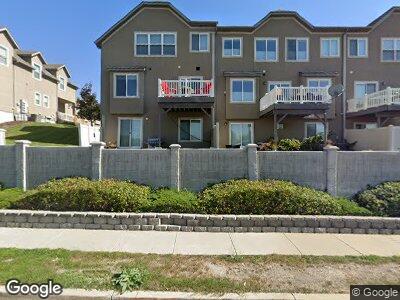
5053 S Oban Ct Holladay, UT 84117
Estimated Value: $644,000 - $721,921
3
Beds
4
Baths
3,564
Sq Ft
$187/Sq Ft
Est. Value
About This Home
This home is located at 5053 S Oban Ct, Holladay, UT 84117 and is currently estimated at $667,980, approximately $187 per square foot. 5053 S Oban Ct is a home located in Salt Lake County with nearby schools including Oakwood Elementary School, Bonneville Junior High School, and Cottonwood High School.
Ownership History
Date
Name
Owned For
Owner Type
Purchase Details
Closed on
Jul 26, 2024
Sold by
Winter Jeffrey L
Bought by
Cheryl Brust Trust
Current Estimated Value
Purchase Details
Closed on
Aug 10, 2021
Sold by
Aidemirova Liana
Bought by
Winter Jeffrey L
Home Financials for this Owner
Home Financials are based on the most recent Mortgage that was taken out on this home.
Original Mortgage
$476,000
Interest Rate
2.8%
Mortgage Type
New Conventional
Purchase Details
Closed on
Aug 9, 2018
Sold by
Prashant Sankara Ishwara Raghu
Bought by
Aidemirova Liana
Purchase Details
Closed on
Apr 23, 2015
Sold by
Tobermory Ridge Llc
Bought by
Sankara Ishwara Raghu Prashanth
Home Financials for this Owner
Home Financials are based on the most recent Mortgage that was taken out on this home.
Original Mortgage
$274,500
Interest Rate
3.8%
Mortgage Type
New Conventional
Create a Home Valuation Report for This Property
The Home Valuation Report is an in-depth analysis detailing your home's value as well as a comparison with similar homes in the area
Home Values in the Area
Average Home Value in this Area
Purchase History
| Date | Buyer | Sale Price | Title Company |
|---|---|---|---|
| Cheryl Brust Trust | -- | Secure Land Title | |
| Winter Jeffrey L | -- | Backman Title Services | |
| Aidemirova Liana | -- | Backman Title Services | |
| Sankara Ishwara Raghu Prashanth | -- | Us Title |
Source: Public Records
Mortgage History
| Date | Status | Borrower | Loan Amount |
|---|---|---|---|
| Previous Owner | Winter Jeffrey L | $476,000 | |
| Previous Owner | Sankara Ishwara Raghu Prashanth | $274,500 | |
| Previous Owner | Tobermory Ridge Llc | $248,000 |
Source: Public Records
Tax History Compared to Growth
Tax History
| Year | Tax Paid | Tax Assessment Tax Assessment Total Assessment is a certain percentage of the fair market value that is determined by local assessors to be the total taxable value of land and additions on the property. | Land | Improvement |
|---|---|---|---|---|
| 2023 | $3,371 | $594,600 | $69,200 | $525,400 |
| 2022 | $3,195 | $566,300 | $67,900 | $498,400 |
| 2021 | $2,987 | $459,900 | $65,160 | $394,740 |
| 2020 | $2,826 | $431,400 | $95,600 | $335,800 |
| 2019 | $2,798 | $415,900 | $90,200 | $325,700 |
| 2018 | $2,676 | $384,800 | $90,200 | $294,600 |
| 2017 | $2,432 | $369,200 | $90,200 | $279,000 |
| 2016 | $2,273 | $347,000 | $93,000 | $254,000 |
| 2015 | $1,767 | $251,600 | $94,300 | $157,300 |
Source: Public Records
Map
Nearby Homes
- 5012 Timber Way Unit 205
- 4985 S Kiska Ln Unit 104
- 4988 Timber Way Unit 310
- 5083 S Escondido St
- 5084 S Escondido St
- 1272 E El Sendero Cir
- 5072 S Camino Real
- 1202 E El Sendero Cir
- 1489 Spring Ln
- 4978 S Del Prado St
- 4850 S 1300 E Unit 4
- 4953 S Eastridge Ln Unit 142
- 1578 E 4945 S Unit 60
- 5188 S Saddleback Dr
- 1400 E Saxony Place Unit D
- 5415 S 1340 E
- 1047 E 5235 S
- 5087 S 1000 E
- 5017 S Middle Fork Ln
- 1169 E Murray Holladay Rd Unit 10