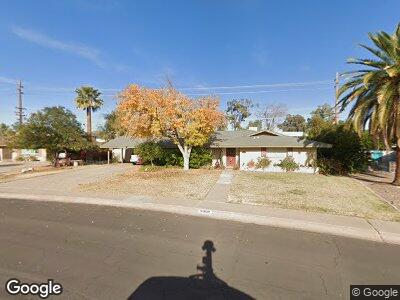
5059 N 38th Place Phoenix, AZ 85018
Camelback East Village NeighborhoodEstimated Value: $1,066,000 - $1,592,000
--
Bed
3
Baths
2,148
Sq Ft
$598/Sq Ft
Est. Value
About This Home
This home is located at 5059 N 38th Place, Phoenix, AZ 85018 and is currently estimated at $1,284,023, approximately $597 per square foot. 5059 N 38th Place is a home located in Maricopa County with nearby schools including Biltmore Preparatory Academy, Camelback High School, and Phoenix Coding Academy.
Ownership History
Date
Name
Owned For
Owner Type
Purchase Details
Closed on
Jan 12, 2011
Sold by
Walsh Rose O
Bought by
Walsh Rose O and The Rose O Walsh Living Trust
Current Estimated Value
Home Financials for this Owner
Home Financials are based on the most recent Mortgage that was taken out on this home.
Original Mortgage
$40,377
Interest Rate
4.43%
Mortgage Type
New Conventional
Purchase Details
Closed on
Nov 5, 2010
Sold by
Walsh Rose O
Bought by
Walsh Rose O
Home Financials for this Owner
Home Financials are based on the most recent Mortgage that was taken out on this home.
Original Mortgage
$40,377
Interest Rate
4.43%
Mortgage Type
New Conventional
Purchase Details
Closed on
Nov 5, 2002
Sold by
Walsh Rose O
Bought by
Walsh Rose O and The Rose O Walsh Living Trust
Home Financials for this Owner
Home Financials are based on the most recent Mortgage that was taken out on this home.
Original Mortgage
$79,000
Interest Rate
5.95%
Purchase Details
Closed on
May 8, 2002
Sold by
Walsh Rose O
Bought by
Walsh Rose O and The Rose O Walsh Living Trust
Create a Home Valuation Report for This Property
The Home Valuation Report is an in-depth analysis detailing your home's value as well as a comparison with similar homes in the area
Home Values in the Area
Average Home Value in this Area
Purchase History
| Date | Buyer | Sale Price | Title Company |
|---|---|---|---|
| Walsh Rose O | -- | None Available | |
| Walsh Rose O | -- | Accommodation | |
| Walsh Rose O | -- | Transnation Title Insurance | |
| Walsh Rose O | -- | Transnation Title Insurance | |
| Walsh Rose O | -- | -- |
Source: Public Records
Mortgage History
| Date | Status | Borrower | Loan Amount |
|---|---|---|---|
| Closed | Walsh Rose O | $40,377 | |
| Closed | Walsh Rose O | $150,000 | |
| Closed | Walsh Rose O | $79,000 |
Source: Public Records
Tax History Compared to Growth
Tax History
| Year | Tax Paid | Tax Assessment Tax Assessment Total Assessment is a certain percentage of the fair market value that is determined by local assessors to be the total taxable value of land and additions on the property. | Land | Improvement |
|---|---|---|---|---|
| 2025 | $4,811 | $41,617 | -- | -- |
| 2024 | $5,015 | -- | -- | -- |
| 2023 | $5,015 | $42,170 | $8,430 | $33,740 |
| 2022 | $5,065 | $42,170 | $8,430 | $33,740 |
| 2021 | $5,493 | $50,560 | $10,110 | $40,450 |
| 2020 | $5,642 | $46,430 | $9,280 | $37,150 |
| 2019 | $5,542 | $46,270 | $9,250 | $37,020 |
| 2018 | $6,093 | $42,170 | $8,430 | $33,740 |
| 2017 | $5,834 | $40,120 | $8,020 | $32,100 |
| 2016 | $5,585 | $35,950 | $7,190 | $28,760 |
| 2015 | $5,485 | $38,000 | $7,600 | $30,400 |
Source: Public Records
Map
Nearby Homes
- 3812 E Camelback Rd
- 3804 E Camelback Rd
- 3825 E Camelback Rd Unit 234
- 3825 E Camelback Rd Unit 142
- 3825 E Camelback Rd Unit 292
- 3825 E Camelback Rd Unit 239
- 3825 E Camelback Rd Unit 290
- 3702 E Camelback Rd
- 5112 N 41st St
- 3922 E Elm St
- 5311 N Palo Cristi Rd
- 3832 E Highland Ave
- 3612 E Pierson St
- 4848 N 36th St Unit 207
- 4670 N 40th St Unit C19
- 5112 N 35th St
- 3653 E Highland Ave
- 4022 E Stanford Dr
- 5555 N Camino Del Contento
- 4704 N 40th Place