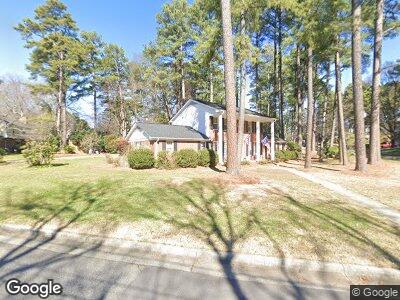
507 Blakewood Dr Raleigh, NC 27609
North Hills NeighborhoodEstimated Value: $762,959 - $842,000
4
Beds
3
Baths
2,622
Sq Ft
$304/Sq Ft
Est. Value
About This Home
This home is located at 507 Blakewood Dr, Raleigh, NC 27609 and is currently estimated at $798,240, approximately $304 per square foot. 507 Blakewood Dr is a home located in Wake County with nearby schools including Douglas Elementary, Carroll Middle, and Sanderson High School.
Ownership History
Date
Name
Owned For
Owner Type
Purchase Details
Closed on
Jan 30, 2018
Sold by
Vanvanrensburg Rudolf Van and Rensburg Meredith Van
Bought by
Mcclure Logan Wilson and Mcclure Sahar Sanjar
Current Estimated Value
Home Financials for this Owner
Home Financials are based on the most recent Mortgage that was taken out on this home.
Original Mortgage
$2,600
Interest Rate
3.94%
Mortgage Type
New Conventional
Purchase Details
Closed on
Dec 9, 2011
Sold by
Oneal Martha B
Bought by
Vanrensburg Rudolf and Van Rensburg Meredith
Home Financials for this Owner
Home Financials are based on the most recent Mortgage that was taken out on this home.
Original Mortgage
$263,155
Interest Rate
3.87%
Mortgage Type
FHA
Purchase Details
Closed on
Jan 30, 2009
Sold by
Oneal Stephen J and Oneal Martha B
Bought by
Oneal Martha B
Create a Home Valuation Report for This Property
The Home Valuation Report is an in-depth analysis detailing your home's value as well as a comparison with similar homes in the area
Home Values in the Area
Average Home Value in this Area
Purchase History
| Date | Buyer | Sale Price | Title Company |
|---|---|---|---|
| Mcclure Logan Wilson | $410,000 | None Available | |
| Vanrensburg Rudolf | $270,000 | None Available | |
| Oneal Martha B | -- | None Available |
Source: Public Records
Mortgage History
| Date | Status | Borrower | Loan Amount |
|---|---|---|---|
| Open | Mcclure Logan | $260,000 | |
| Closed | Mcclure Logan Wilson | $2,600 | |
| Previous Owner | Vanvanrensburg Rudolf Van | $90,000 | |
| Previous Owner | Vanvanrensburg Rudolf Van | $293,700 | |
| Previous Owner | Vanrensburg Rudolf | $263,155 | |
| Previous Owner | Oneal Martha B | $70,000 | |
| Previous Owner | Oneal Stephen J | $118,000 |
Source: Public Records
Tax History Compared to Growth
Tax History
| Year | Tax Paid | Tax Assessment Tax Assessment Total Assessment is a certain percentage of the fair market value that is determined by local assessors to be the total taxable value of land and additions on the property. | Land | Improvement |
|---|---|---|---|---|
| 2024 | $6,163 | $707,260 | $470,000 | $237,260 |
| 2023 | $4,866 | $444,593 | $250,000 | $194,593 |
| 2022 | $4,377 | $430,293 | $250,000 | $180,293 |
| 2021 | $4,207 | $430,293 | $250,000 | $180,293 |
| 2020 | $4,130 | $430,293 | $250,000 | $180,293 |
| 2019 | $4,253 | $365,247 | $130,000 | $235,247 |
| 2018 | $4,011 | $365,247 | $130,000 | $235,247 |
| 2017 | $3,278 | $313,139 | $130,000 | $183,139 |
| 2016 | $3,210 | $313,139 | $130,000 | $183,139 |
| 2015 | $2,710 | $259,780 | $95,000 | $164,780 |
| 2014 | $2,571 | $259,780 | $95,000 | $164,780 |
Source: Public Records
Map
Nearby Homes
- 5208 Knollwood Rd
- 4900 Skidmore St
- 4913 Great Meadows Ct
- 5004 Lakemont Dr
- 104 Pinecroft Dr
- 4812 Stonehill Dr
- 5505 Knollwood Rd
- 5412 Farley Dr
- 4800 Lakemont Dr
- 4812 Latimer Rd
- 400 Cottonwood Cir
- 505 Harvard St
- 129 Windel Dr
- 309 E Millbrook Rd
- 317 Compton Rd
- 717 E Millbrook Rd Unit 717
- 642 Pine Ridge Place Unit 642
- 612 Pine Ridge Place
- 626 Pine Ridge Place
- 550 Pine Ridge Place