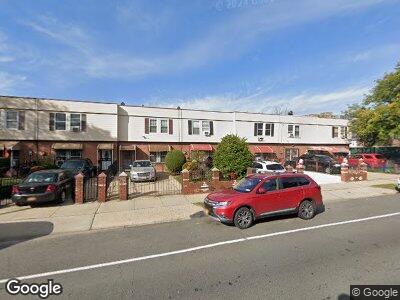
508 Thomas S Boyland St Brooklyn, NY 11212
Brownsville NeighborhoodEstimated Value: $557,133 - $643,000
2
Beds
2
Baths
1,340
Sq Ft
$442/Sq Ft
Est. Value
About This Home
This home is located at 508 Thomas S Boyland St, Brooklyn, NY 11212 and is currently estimated at $592,783, approximately $442 per square foot. 508 Thomas S Boyland St is a home located in Kings County with nearby schools including P.S. 156 Waverly, P.S. 150 - Christopher, and P.S. 165 Ida Posner.
Ownership History
Date
Name
Owned For
Owner Type
Purchase Details
Closed on
Nov 2, 2022
Sold by
Estate Of Yolanda Garrido and Shirley Gonzalvez Administrator
Bought by
Gonzalvez Shirley
Current Estimated Value
Home Financials for this Owner
Home Financials are based on the most recent Mortgage that was taken out on this home.
Original Mortgage
$241,200
Outstanding Balance
$236,643
Interest Rate
7.08%
Mortgage Type
Purchase Money Mortgage
Estimated Equity
$349,883
Purchase Details
Closed on
Jun 26, 2015
Sold by
Garrido Yolanda and Mendoza Nannette
Bought by
Garrido Yolanda
Home Financials for this Owner
Home Financials are based on the most recent Mortgage that was taken out on this home.
Original Mortgage
$435,000
Interest Rate
4.07%
Mortgage Type
Reverse Mortgage Home Equity Conversion Mortgage
Purchase Details
Closed on
Jan 27, 2003
Sold by
Yolonda Garrido and Yolonda Garrida
Bought by
Yolonda Garrido and Yolonda Garrida
Create a Home Valuation Report for This Property
The Home Valuation Report is an in-depth analysis detailing your home's value as well as a comparison with similar homes in the area
Home Values in the Area
Average Home Value in this Area
Purchase History
| Date | Buyer | Sale Price | Title Company |
|---|---|---|---|
| Gonzalvez Shirley | -- | -- | |
| Garrido Yolanda | -- | -- | |
| Yolonda Garrido | -- | -- |
Source: Public Records
Mortgage History
| Date | Status | Borrower | Loan Amount |
|---|---|---|---|
| Open | Gonzalvez Shirley | $241,200 | |
| Previous Owner | Garrido Yolanda | $435,000 | |
| Previous Owner | Garrida Yolanda | $120,000 | |
| Previous Owner | Garrida Yolanda | $24,000 |
Source: Public Records
Tax History Compared to Growth
Tax History
| Year | Tax Paid | Tax Assessment Tax Assessment Total Assessment is a certain percentage of the fair market value that is determined by local assessors to be the total taxable value of land and additions on the property. | Land | Improvement |
|---|---|---|---|---|
| 2024 | $4,690 | $34,440 | $14,400 | $20,040 |
| 2023 | $4,474 | $32,700 | $14,400 | $18,300 |
| 2022 | $4,398 | $34,440 | $14,400 | $20,040 |
| 2021 | $4,602 | $30,240 | $14,400 | $15,840 |
| 2020 | $4,341 | $26,580 | $14,400 | $12,180 |
| 2019 | $4,071 | $26,580 | $14,400 | $12,180 |
| 2018 | $3,743 | $18,360 | $14,400 | $3,960 |
| 2017 | $3,801 | $18,648 | $13,645 | $5,003 |
| 2016 | $3,713 | $18,576 | $14,381 | $4,195 |
| 2015 | $1,902 | $18,120 | $12,000 | $6,120 |
| 2014 | $1,902 | $17,460 | $11,718 | $5,742 |
Source: Public Records
Map
Nearby Homes
- 68 Herzl St
- 133 Herzl St
- 1585 Pitkin Ave
- 179 Amboy St
- 1941 Strauss St
- 67 Chester St Unit 3
- 589 Saratoga Ave
- 51 Chester St
- 1574 Eastern Pkwy
- 1814 Saint Johns Place Unit B4
- 121 Legion St
- 1563 Eastern Pkwy
- 1788 Saint Johns Place
- 1508 Eastern Pkwy
- 117 Osborn St
- 1744 Pitkin Ave
- 288 Chester St
- 1509 Eastern Pkwy
- 687 Saratoga Ave
- 1871 Prospect Place