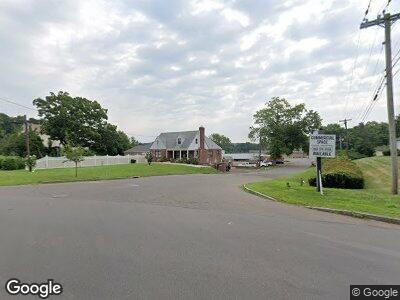
509 Laurel St East Haven, CT 06512
North End NeighborhoodEstimated Value: $634,424
--
Bed
--
Bath
--
Sq Ft
1.25
Acres
About This Home
This home is located at 509 Laurel St, East Haven, CT 06512 and is currently priced at $634,424. 509 Laurel St is a home located in New Haven County with nearby schools including East Haven High School, St Francis & St Rose Of Lima School, and All Nations Christian Academy.
Ownership History
Date
Name
Owned For
Owner Type
Purchase Details
Closed on
Dec 26, 2019
Sold by
509 Laurel St Llc
Bought by
Mds Real Estate Holdings
Current Estimated Value
Purchase Details
Closed on
Dec 10, 2008
Sold by
Cinque Louis F and Cinque Salvatore J
Bought by
509 Laurel Street Llc
Home Financials for this Owner
Home Financials are based on the most recent Mortgage that was taken out on this home.
Original Mortgage
$150,000
Interest Rate
6.49%
Mortgage Type
Commercial
Create a Home Valuation Report for This Property
The Home Valuation Report is an in-depth analysis detailing your home's value as well as a comparison with similar homes in the area
Home Values in the Area
Average Home Value in this Area
Purchase History
| Date | Buyer | Sale Price | Title Company |
|---|---|---|---|
| Mds Real Estate Holdings | -- | None Available | |
| 509 Laurel Street Llc | $300,000 | -- |
Source: Public Records
Mortgage History
| Date | Status | Borrower | Loan Amount |
|---|---|---|---|
| Previous Owner | Shoreline Trl Ct H Llc | $150,000 | |
| Previous Owner | Shoreline Trl Ct H Llc | $800,000 |
Source: Public Records
Tax History Compared to Growth
Tax History
| Year | Tax Paid | Tax Assessment Tax Assessment Total Assessment is a certain percentage of the fair market value that is determined by local assessors to be the total taxable value of land and additions on the property. | Land | Improvement |
|---|---|---|---|---|
| 2024 | $10,709 | $320,250 | $103,320 | $216,930 |
| 2023 | $9,992 | $320,250 | $103,320 | $216,930 |
| 2022 | $9,992 | $320,250 | $103,320 | $216,930 |
| 2021 | $10,469 | $305,670 | $86,100 | $219,570 |
| 2020 | $10,469 | $305,670 | $86,100 | $219,570 |
| 2019 | $9,910 | $305,670 | $86,100 | $219,570 |
| 2018 | $9,919 | $305,670 | $86,100 | $219,570 |
| 2017 | $9,644 | $305,670 | $86,100 | $219,570 |
| 2016 | $8,206 | $260,080 | $86,100 | $173,980 |
| 2015 | $8,206 | $260,080 | $86,100 | $173,980 |
| 2014 | $8,336 | $260,080 | $86,100 | $173,980 |
Source: Public Records
Map
Nearby Homes