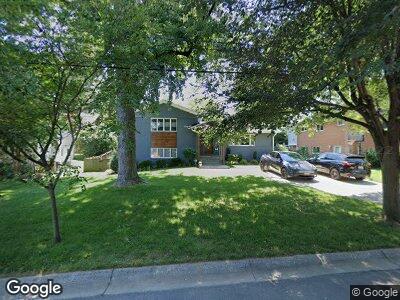
5106 Viking Rd Bethesda, MD 20814
Alta Vista NeighborhoodEstimated Value: $1,156,000 - $1,489,000
4
Beds
3
Baths
2,190
Sq Ft
$588/Sq Ft
Est. Value
About This Home
This home is located at 5106 Viking Rd, Bethesda, MD 20814 and is currently estimated at $1,288,756, approximately $588 per square foot. 5106 Viking Rd is a home located in Montgomery County with nearby schools including Wyngate Elementary School, North Bethesda Middle School, and Walter Johnson High School.
Ownership History
Date
Name
Owned For
Owner Type
Purchase Details
Closed on
Oct 27, 2009
Sold by
Adams Natalie
Bought by
Ranzer Alan and Ranzer Beth
Current Estimated Value
Home Financials for this Owner
Home Financials are based on the most recent Mortgage that was taken out on this home.
Original Mortgage
$716,777
Interest Rate
5.09%
Mortgage Type
FHA
Purchase Details
Closed on
May 2, 2005
Sold by
Adams Benson Et Al Tr
Bought by
Adams Benson Et Al Tr
Purchase Details
Closed on
Apr 25, 2005
Sold by
Adams Benson Et Al Tr
Bought by
Adams Benson Et Al Tr
Purchase Details
Closed on
Jan 23, 2004
Sold by
Adams Benson and Adams Natalie
Bought by
Adams Benson Et Al Tr
Purchase Details
Closed on
Sep 9, 2003
Sold by
Adams Natalie Et Al Tr
Bought by
Adams Benson and Adams Natalie
Purchase Details
Closed on
Jul 29, 1999
Sold by
Adams Benson D and Adams B N
Bought by
Adams Natalie Et Al Tr
Create a Home Valuation Report for This Property
The Home Valuation Report is an in-depth analysis detailing your home's value as well as a comparison with similar homes in the area
Home Values in the Area
Average Home Value in this Area
Purchase History
| Date | Buyer | Sale Price | Title Company |
|---|---|---|---|
| Ranzer Alan | $730,000 | -- | |
| Adams Benson Et Al Tr | -- | -- | |
| Adams Benson Et Al Tr | -- | -- | |
| Adams Benson Et Al Tr | -- | -- | |
| Adams Benson Et Al Tr | -- | -- | |
| Adams Benson | -- | -- | |
| Adams Natalie Et Al Tr | -- | -- |
Source: Public Records
Mortgage History
| Date | Status | Borrower | Loan Amount |
|---|---|---|---|
| Open | Ranzer Alan | $300,000 | |
| Open | Ranzer Alan | $710,000 | |
| Closed | Ranzer Alan | $780,000 | |
| Closed | Ranzer Alan | $780,000 | |
| Closed | Ranzer Alan | $721,104 | |
| Closed | Ranzer Beth | $716,777 |
Source: Public Records
Tax History Compared to Growth
Tax History
| Year | Tax Paid | Tax Assessment Tax Assessment Total Assessment is a certain percentage of the fair market value that is determined by local assessors to be the total taxable value of land and additions on the property. | Land | Improvement |
|---|---|---|---|---|
| 2024 | $11,044 | $895,800 | $556,700 | $339,100 |
| 2023 | $9,893 | $857,667 | $0 | $0 |
| 2022 | $9,005 | $819,533 | $0 | $0 |
| 2021 | $8,355 | $781,400 | $530,200 | $251,200 |
| 2020 | $8,355 | $769,833 | $0 | $0 |
| 2019 | $8,190 | $758,267 | $0 | $0 |
| 2018 | $8,046 | $746,700 | $504,900 | $241,800 |
| 2017 | $7,561 | $691,267 | $0 | $0 |
| 2016 | $6,132 | $635,833 | $0 | $0 |
| 2015 | $6,132 | $580,400 | $0 | $0 |
| 2014 | $6,132 | $580,400 | $0 | $0 |
Source: Public Records
Map
Nearby Homes
- 9416 Holland Ct
- 5206 Danbury Rd
- 22 Dudley Ct
- 5218 Danbury Rd
- 9313 Linden Ave
- 5420 Linden Ct
- 9202 Cedarcrest Dr
- 9541 Wildoak Dr
- 5205 Camberley Ave
- 9404 Spruce Tree Cir
- 5225 Pooks Hill Rd
- 5225 Pooks Hill Rd
- 5225 Pooks Hill Rd
- 5225 Pooks Hill Rd
- 5225 Pooks Hill Rd
- 5225 Pooks Hill Rd
- 5225 Pooks Hill Rd
- 5225 Pooks Hill Rd
- 5225 Pooks Hill Rd
- 5225 Pooks Hill Rd