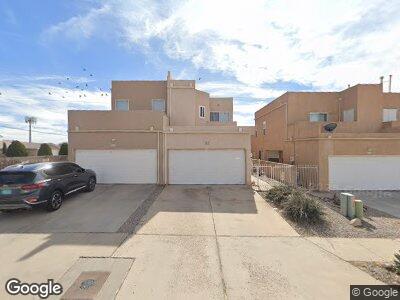
5108 Levy Ct NW Albuquerque, NM 87120
West Bluff NeighborhoodEstimated Value: $219,000 - $232,000
2
Beds
3
Baths
1,090
Sq Ft
$206/Sq Ft
Est. Value
About This Home
This home is located at 5108 Levy Ct NW, Albuquerque, NM 87120 and is currently estimated at $224,459, approximately $205 per square foot. 5108 Levy Ct NW is a home located in Bernalillo County with nearby schools including Susie R. Marmon Elementary School, John Adams Middle School, and West Mesa High School.
Ownership History
Date
Name
Owned For
Owner Type
Purchase Details
Closed on
Jun 26, 2007
Sold by
Beasley Phillip H
Bought by
Lopez Diana M
Current Estimated Value
Home Financials for this Owner
Home Financials are based on the most recent Mortgage that was taken out on this home.
Original Mortgage
$52,000
Interest Rate
6.19%
Mortgage Type
Purchase Money Mortgage
Purchase Details
Closed on
May 18, 2005
Sold by
Stine Jennifer K
Bought by
Beasley Phillip H
Home Financials for this Owner
Home Financials are based on the most recent Mortgage that was taken out on this home.
Original Mortgage
$107,155
Interest Rate
5.92%
Mortgage Type
VA
Purchase Details
Closed on
Dec 9, 1998
Sold by
Macduffee Keith and Macduffee Patricia
Bought by
Stine Jennifer K
Home Financials for this Owner
Home Financials are based on the most recent Mortgage that was taken out on this home.
Original Mortgage
$80,350
Interest Rate
6.81%
Mortgage Type
FHA
Create a Home Valuation Report for This Property
The Home Valuation Report is an in-depth analysis detailing your home's value as well as a comparison with similar homes in the area
Home Values in the Area
Average Home Value in this Area
Purchase History
| Date | Buyer | Sale Price | Title Company |
|---|---|---|---|
| Lopez Diana M | -- | U S Title | |
| Beasley Phillip H | -- | Us Title | |
| Stine Jennifer K | -- | First American Title Co |
Source: Public Records
Mortgage History
| Date | Status | Borrower | Loan Amount |
|---|---|---|---|
| Open | Lopez Diana M | $33,500 | |
| Closed | Lopez Diana M | $52,000 | |
| Previous Owner | Beasley Phillip H | $107,155 | |
| Previous Owner | Stine Jennifer K | $80,350 |
Source: Public Records
Tax History Compared to Growth
Tax History
| Year | Tax Paid | Tax Assessment Tax Assessment Total Assessment is a certain percentage of the fair market value that is determined by local assessors to be the total taxable value of land and additions on the property. | Land | Improvement |
|---|---|---|---|---|
| 2024 | $678 | $28,997 | $5,166 | $23,831 |
| 2023 | $854 | $28,997 | $5,166 | $23,831 |
| 2022 | $1,148 | $28,997 | $5,166 | $23,831 |
| 2021 | $1,143 | $28,997 | $5,166 | $23,831 |
| 2020 | $1,158 | $28,997 | $5,166 | $23,831 |
| 2019 | $1,158 | $28,997 | $5,166 | $23,831 |
| 2018 | $1,150 | $28,997 | $5,166 | $23,831 |
| 2017 | $1,148 | $28,997 | $5,166 | $23,831 |
| 2016 | $1,192 | $30,027 | $6,841 | $23,186 |
| 2015 | $30,027 | $30,027 | $6,841 | $23,186 |
| 2014 | $1,190 | $30,027 | $6,841 | $23,186 |
| 2013 | -- | $29,153 | $6,642 | $22,511 |
Source: Public Records
Map
Nearby Homes
- 2700 Vista Grande Dr NW Unit 56
- 2700 Vista Grande Dr NW Unit 31
- 2700 Vista Grande Dr NW Unit 87
- 2700 Vista Grande Dr NW Unit 66
- 2700 Vista Grande Dr NW Unit 34
- 3008 Corona Dr NW
- 0 Alamogordo Dr NW Unit 1082031
- 0 Alamogordo Dr NW Unit 1081087
- 0 Alamogordo Dr NW Unit 1081086
- 0 Vista Grande Dr NW Unit 1082028
- 0 Vista Grande Dr NW Unit 1082027
- 0 Vista Grande Dr NW Unit 1082024
- 5020 Orion Ave NW
- 3130 Vista Grande Dr NW
- 5219 Chris Ct NW
- 3401 Grande Vista Place NW
- 2956 Estrella Brillante St NW
- 2404 Tompiro Rd NW
- 2834 Prenda de Oro NW
- 5912 Gran Quivira Rd NW