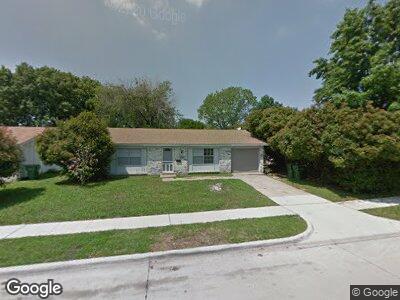
5109 Frontier Rd Garland, TX 75043
New West NeighborhoodEstimated Value: $250,000 - $285,770
3
Beds
2
Baths
1,184
Sq Ft
$230/Sq Ft
Est. Value
About This Home
This home is located at 5109 Frontier Rd, Garland, TX 75043 and is currently estimated at $272,693, approximately $230 per square foot. 5109 Frontier Rd is a home located in Dallas County.
Ownership History
Date
Name
Owned For
Owner Type
Purchase Details
Closed on
Dec 27, 2016
Sold by
Iyen Rhonda and Iyen Williamson Rhoda
Bought by
Cardena Roberto C and Ibarra Norma Elena Huerta
Current Estimated Value
Home Financials for this Owner
Home Financials are based on the most recent Mortgage that was taken out on this home.
Original Mortgage
$121,500
Outstanding Balance
$84,390
Interest Rate
3.94%
Mortgage Type
New Conventional
Estimated Equity
$194,236
Purchase Details
Closed on
May 12, 2004
Sold by
Dokes Clarissa
Bought by
Iyen Rhonda
Home Financials for this Owner
Home Financials are based on the most recent Mortgage that was taken out on this home.
Original Mortgage
$15,000
Interest Rate
5.93%
Mortgage Type
Unknown
Purchase Details
Closed on
Apr 27, 2001
Sold by
Walker Douglas Ray and Walker Regeana Mae
Bought by
Dokes Clarissa
Home Financials for this Owner
Home Financials are based on the most recent Mortgage that was taken out on this home.
Original Mortgage
$63,498
Interest Rate
6.99%
Mortgage Type
FHA
Create a Home Valuation Report for This Property
The Home Valuation Report is an in-depth analysis detailing your home's value as well as a comparison with similar homes in the area
Home Values in the Area
Average Home Value in this Area
Purchase History
| Date | Buyer | Sale Price | Title Company |
|---|---|---|---|
| Cardena Roberto C | -- | None Available | |
| Iyen Rhonda | -- | -- | |
| Dokes Clarissa | -- | -- |
Source: Public Records
Mortgage History
| Date | Status | Borrower | Loan Amount |
|---|---|---|---|
| Open | Cardena Roberto C | $121,500 | |
| Previous Owner | City Of Garland Hsng & Neighborhood Svcs | $15,000 | |
| Previous Owner | Iyen Rhonda | $78,155 | |
| Previous Owner | Dokes Clarissa | $63,498 |
Source: Public Records
Tax History Compared to Growth
Tax History
| Year | Tax Paid | Tax Assessment Tax Assessment Total Assessment is a certain percentage of the fair market value that is determined by local assessors to be the total taxable value of land and additions on the property. | Land | Improvement |
|---|---|---|---|---|
| 2023 | $3,575 | $220,440 | $40,000 | $180,440 |
| 2022 | $5,420 | $220,440 | $40,000 | $180,440 |
| 2021 | $4,356 | $165,660 | $40,000 | $125,660 |
| 2020 | $4,416 | $165,660 | $40,000 | $125,660 |
| 2019 | $4,054 | $143,700 | $32,000 | $111,700 |
| 2018 | $3,935 | $139,470 | $30,000 | $109,470 |
| 2017 | $3,775 | $133,910 | $25,000 | $108,910 |
| 2016 | $2,787 | $98,850 | $20,000 | $78,850 |
| 2015 | $1,926 | $77,250 | $20,000 | $57,250 |
| 2014 | $1,926 | $73,470 | $20,000 | $53,470 |
Source: Public Records
Map
Nearby Homes
- 5217 Stagecoach Ln
- 5014 Palomino Ln
- 408 San Maria Dr
- 5004 Palo Alto Dr
- 4902 Stagecoach Ln
- 5037 Collingwood Dr
- 5324 Broadway Blvd
- 4832 Rollingwood Ct
- 702 Laguna Dr
- 710 Longbeach Dr
- 4918 Cliffwood Dr
- 5221 Collingwood Dr
- 718 Angle Ridge Cir
- 738 Longbeach Dr
- 810 Malibu Dr
- 905 Longbeach Dr
- 425 Solitude Dr
- 910 Meadowcove Cir
- 4602 Oakwood Dr
- 7337 Farmhouse Dr