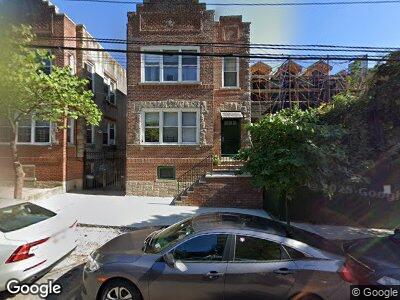
5110 Post Rd Bronx, NY 10471
Fieldston NeighborhoodEstimated Value: $926,000 - $1,192,633
5
Beds
4
Baths
3,491
Sq Ft
$311/Sq Ft
Est. Value
About This Home
This home is located at 5110 Post Rd, Bronx, NY 10471 and is currently estimated at $1,086,658, approximately $311 per square foot. 5110 Post Rd is a home located in Bronx County with nearby schools including P.S. 81 - Robert J. Christen, Riverdale Kingsbridge Academy, and Horace Mann School Lower Division.
Ownership History
Date
Name
Owned For
Owner Type
Purchase Details
Closed on
Oct 11, 2023
Sold by
Marie B Sansone Taylor Living Trust Dt and Marie B Sansone Taylor Trustee
Bought by
Chen Eson Feng and Gao Zhong
Current Estimated Value
Home Financials for this Owner
Home Financials are based on the most recent Mortgage that was taken out on this home.
Original Mortgage
$637,500
Outstanding Balance
$629,059
Interest Rate
7.18%
Mortgage Type
Purchase Money Mortgage
Estimated Equity
$430,698
Purchase Details
Closed on
Feb 5, 2004
Sold by
Taylor Marie Sansone
Bought by
Marie B Sansone Taylor As Trustee
Purchase Details
Closed on
May 26, 1999
Sold by
Taylor Marie B and Sansone Michael J
Bought by
Taylor Marie Sansone and Dalton Barbara A
Home Financials for this Owner
Home Financials are based on the most recent Mortgage that was taken out on this home.
Original Mortgage
$217,500
Interest Rate
7.49%
Mortgage Type
Purchase Money Mortgage
Create a Home Valuation Report for This Property
The Home Valuation Report is an in-depth analysis detailing your home's value as well as a comparison with similar homes in the area
Home Values in the Area
Average Home Value in this Area
Purchase History
| Date | Buyer | Sale Price | Title Company |
|---|---|---|---|
| Chen Eson Feng | $850,000 | -- | |
| Chen Eson Feng | $850,000 | -- | |
| Marie B Sansone Taylor As Trustee | -- | -- | |
| Marie B Sansone Taylor As Trustee | -- | -- | |
| Taylor Marie Sansone | -- | Titleserv | |
| Taylor Marie Sansone | $152,500 | Titleserv | |
| Taylor Marie Sansone | -- | Titleserv |
Source: Public Records
Mortgage History
| Date | Status | Borrower | Loan Amount |
|---|---|---|---|
| Open | Chen Eson Feng | $637,500 | |
| Closed | Chen Eson Feng | $637,500 | |
| Previous Owner | Sansone Taylor Marie B | $210,000 | |
| Previous Owner | Taylor Marie Sansone | $217,500 |
Source: Public Records
Tax History Compared to Growth
Tax History
| Year | Tax Paid | Tax Assessment Tax Assessment Total Assessment is a certain percentage of the fair market value that is determined by local assessors to be the total taxable value of land and additions on the property. | Land | Improvement |
|---|---|---|---|---|
| 2024 | $10,171 | $50,640 | $9,661 | $40,979 |
| 2023 | $9,702 | $47,774 | $9,612 | $38,162 |
| 2022 | $9,027 | $74,580 | $16,140 | $58,440 |
| 2021 | $9,978 | $78,300 | $16,140 | $62,160 |
| 2020 | $9,467 | $67,740 | $16,140 | $51,600 |
| 2019 | $8,828 | $54,600 | $16,140 | $38,460 |
| 2018 | $8,116 | $39,812 | $13,522 | $26,290 |
| 2017 | $8,116 | $39,812 | $14,336 | $25,476 |
| 2016 | $7,899 | $39,512 | $15,098 | $24,414 |
| 2015 | $4,530 | $37,276 | $16,014 | $21,262 |
| 2014 | $4,530 | $35,167 | $12,839 | $22,328 |
Source: Public Records
Map
Nearby Homes
- 5122 Post Rd
- 5163 Post Rd
- 224 W 252nd St
- 5235 Post Rd Unit 6B
- 5235 Post Rd Unit 2C
- 5235 Post Rd Unit 2 J
- 5235 Post Rd Unit 3H
- 5411 Post Rd
- 4445 Post Rd Unit 4D
- 4445 Post Rd Unit 4-G
- 4930 Goodridge Ave
- 5041 Goodridge Ave
- 6035 Broadway Unit 6N
- 4456 Waldo Ave
- 5020 Grosvenor Ave
- 5000 Grosvenor Ave
- 4525 Greystone Ave
- 4410 Cayuga Ave Unit 1D
- 4720 Grosvenor Ave
- 5000 Iselin Ave