L
Seller's Agent in 2024
Lily Do
Lone Star Realty
(281) 650-4789
38 Total Sales
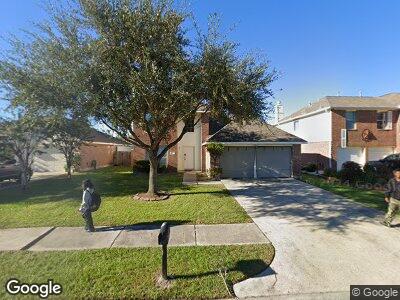
2 story home with lots of natural lights, formal dining area, kitchen open to family and owner's retreat on first floor with a spacious walk-in closet. Come see for yourself. NO ANIMALS.
| Date | Buyer | Sale Price | Title Company |
|---|---|---|---|
| Vo Vinh | -- | Chicago Title | |
| Tran My Linh Thi | -- | Stewart Title Houston Div |
| Date | Status | Borrower | Loan Amount |
|---|---|---|---|
| Previous Owner | Tran My Linh Thi | $104,000 | |
| Previous Owner | Tran My Linh Thi | $114,752 | |
| Previous Owner | Tran My Linh Thi | $28,688 |
| Date | Event | Price | Change | Sq Ft Price |
|---|---|---|---|---|
| 05/20/2024 05/20/24 | Rented | $2,200 | 0.0% | -- |
| 03/31/2024 03/31/24 | Under Contract | -- | -- | -- |
| 01/03/2024 01/03/24 | For Rent | $2,200 | 0.0% | -- |
| 01/02/2024 01/02/24 | For Rent | $2,200 | 0.0% | -- |
| 12/31/2023 12/31/23 | Off Market | $2,200 | -- | -- |
| 11/13/2023 11/13/23 | For Rent | $2,200 | +10.0% | -- |
| 01/28/2023 01/28/23 | Rented | $2,000 | 0.0% | -- |
| 01/23/2023 01/23/23 | Under Contract | -- | -- | -- |
| 01/10/2023 01/10/23 | For Rent | $2,000 | 0.0% | -- |
| 10/08/2021 10/08/21 | For Rent | $2,000 | 0.0% | -- |
| 10/08/2021 10/08/21 | Rented | $2,000 | -- | -- |
| Year | Tax Paid | Tax Assessment Tax Assessment Total Assessment is a certain percentage of the fair market value that is determined by local assessors to be the total taxable value of land and additions on the property. | Land | Improvement |
|---|---|---|---|---|
| 2023 | $6,137 | $260,798 | $43,121 | $217,677 |
| 2022 | $5,788 | $235,224 | $23,956 | $211,268 |
| 2021 | $5,117 | $196,301 | $23,956 | $172,345 |
| 2020 | $5,014 | $180,139 | $23,956 | $156,183 |
| 2019 | $4,917 | $170,414 | $24,265 | $146,149 |
| 2018 | $4,640 | $153,632 | $24,265 | $129,367 |
| 2017 | $4,211 | $147,618 | $24,265 | $123,353 |
| 2016 | $4,211 | $147,618 | $24,265 | $123,353 |
| 2015 | $3,721 | $133,401 | $24,265 | $109,136 |
| 2014 | $3,721 | $128,356 | $24,265 | $104,091 |
L
Seller's Agent in 2024
Lily Do
Lone Star Realty
(281) 650-4789
38 Total Sales

Buyer's Agent in 2024
Mohammed Jaber
LPT Realty, LLC
(936) 525-3200
36 Total Sales
C
Buyer's Agent in 2023
Cameron Hill
HomePoint Realty Group
B
Buyer's Agent in 2021
Brooke Franke
AEA Realty, LLC
(281) 570-5231
83 Total Sales