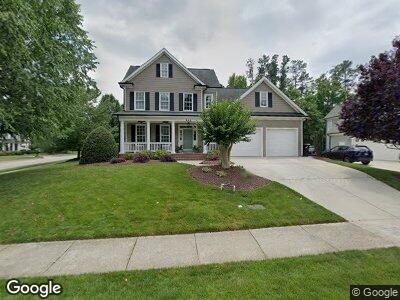
512 Wescott Ridge Dr Holly Springs, NC 27540
Estimated Value: $716,349 - $781,000
4
Beds
4
Baths
2,868
Sq Ft
$262/Sq Ft
Est. Value
About This Home
This home is located at 512 Wescott Ridge Dr, Holly Springs, NC 27540 and is currently estimated at $751,337, approximately $261 per square foot. 512 Wescott Ridge Dr is a home located in Wake County with nearby schools including Middle Creek Elementary School, Holly Ridge Middle School, and Holly Springs High School.
Ownership History
Date
Name
Owned For
Owner Type
Purchase Details
Closed on
Jul 12, 2007
Sold by
Petroccione Richard E and Petroccione Debra J
Bought by
Mattern Michael D and Mattern Ann
Current Estimated Value
Home Financials for this Owner
Home Financials are based on the most recent Mortgage that was taken out on this home.
Original Mortgage
$165,000
Interest Rate
6.65%
Mortgage Type
Credit Line Revolving
Purchase Details
Closed on
Sep 21, 2006
Sold by
Robuck Homes Triangle Llc
Bought by
Petroccione Richard E and Petroccione Debra J
Home Financials for this Owner
Home Financials are based on the most recent Mortgage that was taken out on this home.
Original Mortgage
$287,900
Interest Rate
6.52%
Mortgage Type
Purchase Money Mortgage
Create a Home Valuation Report for This Property
The Home Valuation Report is an in-depth analysis detailing your home's value as well as a comparison with similar homes in the area
Home Values in the Area
Average Home Value in this Area
Purchase History
| Date | Buyer | Sale Price | Title Company |
|---|---|---|---|
| Mattern Michael D | $394,500 | None Available | |
| Petroccione Richard E | $398,000 | None Available |
Source: Public Records
Mortgage History
| Date | Status | Borrower | Loan Amount |
|---|---|---|---|
| Open | Mattern Michael D | $145,000 | |
| Closed | Mattern Michael | $181,000 | |
| Closed | Mattern Michael D | $185,000 | |
| Closed | Mattern Michael D | $100,000 | |
| Closed | Mattern Michael D | $150,000 | |
| Closed | Mattern Michael D | $165,000 | |
| Closed | Mattern Michael D | $150,000 | |
| Previous Owner | Petroccione Richard E | $287,900 |
Source: Public Records
Tax History Compared to Growth
Tax History
| Year | Tax Paid | Tax Assessment Tax Assessment Total Assessment is a certain percentage of the fair market value that is determined by local assessors to be the total taxable value of land and additions on the property. | Land | Improvement |
|---|---|---|---|---|
| 2024 | $5,674 | $659,745 | $130,000 | $529,745 |
| 2023 | $4,860 | $448,725 | $105,000 | $343,725 |
| 2022 | $4,692 | $448,725 | $105,000 | $343,725 |
| 2021 | $4,604 | $448,725 | $105,000 | $343,725 |
| 2020 | $4,604 | $448,725 | $105,000 | $343,725 |
| 2019 | $4,803 | $397,497 | $90,000 | $307,497 |
| 2018 | $4,340 | $397,497 | $90,000 | $307,497 |
| 2017 | $4,184 | $397,497 | $90,000 | $307,497 |
| 2016 | $4,126 | $397,497 | $90,000 | $307,497 |
| 2015 | $4,380 | $415,433 | $79,000 | $336,433 |
| 2014 | $4,228 | $415,433 | $79,000 | $336,433 |
Source: Public Records
Map
Nearby Homes
- 120 Breyla Way
- 108 Vintage Pine Ct
- 301 Marsh Landing Dr
- 108 Eden Glen Dr
- 504 Skygrove Dr
- 108 Cross Oaks Place
- 109 Skywater Ln
- 401 Streamwood Dr
- 109 Aspenridge Dr
- 5301 Crocus Ct
- 5413 Leopards Bane Ct
- 116 Arlen Park Place
- 205 Quarryrock Rd
- 105 Presley Snow Ct
- 101 Quarryrock Rd
- 4721 Cypress Ford Dr
- 9817 Holly Springs Rd
- 0 Holly Springs Rd Unit 10071653
- 4001 Gatewood Falls Ct
- 4808 Clubview Ct