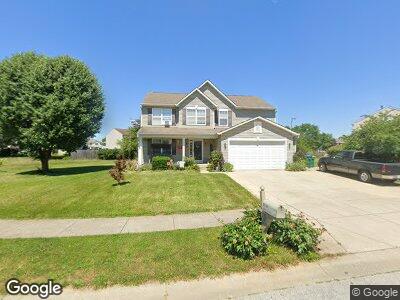
5126 Clay Creek Ln Plainfield, IN 46168
Estimated Value: $360,000 - $375,000
4
Beds
3
Baths
2,895
Sq Ft
$126/Sq Ft
Est. Value
About This Home
This home is located at 5126 Clay Creek Ln, Plainfield, IN 46168 and is currently estimated at $365,381, approximately $126 per square foot. 5126 Clay Creek Ln is a home located in Hendricks County with nearby schools including Central Elementary School, Plainfield Community Middle School, and Plainfield High School.
Create a Home Valuation Report for This Property
The Home Valuation Report is an in-depth analysis detailing your home's value as well as a comparison with similar homes in the area
Home Values in the Area
Average Home Value in this Area
Tax History Compared to Growth
Tax History
| Year | Tax Paid | Tax Assessment Tax Assessment Total Assessment is a certain percentage of the fair market value that is determined by local assessors to be the total taxable value of land and additions on the property. | Land | Improvement |
|---|---|---|---|---|
| 2024 | $3,158 | $327,400 | $66,600 | $260,800 |
| 2023 | $2,936 | $311,800 | $63,400 | $248,400 |
| 2022 | $2,886 | $288,600 | $58,400 | $230,200 |
| 2021 | $2,586 | $258,600 | $55,000 | $203,600 |
| 2020 | $2,399 | $239,900 | $55,000 | $184,900 |
| 2019 | $2,130 | $220,600 | $50,400 | $170,200 |
| 2018 | $2,056 | $209,900 | $50,400 | $159,500 |
| 2017 | $1,886 | $189,900 | $47,300 | $142,600 |
| 2016 | $1,873 | $189,400 | $47,300 | $142,100 |
| 2014 | $1,712 | $173,500 | $43,000 | $130,500 |
Source: Public Records
Map
Nearby Homes
- 3792 Waterfront Way
- 4889 Lilium Dr
- 5003 Lilium Dr
- 5069 Lilium Dr
- 3642 Homestead Cir W
- 4993 Silverbell Dr
- 4208 Payne Dr
- 5374 Marigold Dr
- 4179 Hume Ave
- 3688 Lisa Ln
- 5397 John Quincy Adams Ct
- 5766 Kensington Way S
- 4283 Washington Blvd
- 5810 Grand Ave
- 4592 Gordon Dr
- 3342 Challenger Dr
- 3699 Lisa Ln
- 4545 Connaught Dr E
- 4709 S County Road 500 E
- 4257 Tattersall Dr