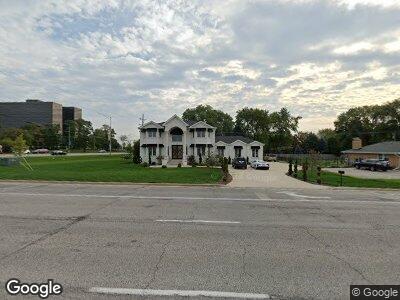
513 N Meacham Rd Schaumburg, IL 60173
East Schaumburg NeighborhoodEstimated Value: $753,000
5
Beds
4
Baths
3,283
Sq Ft
$229/Sq Ft
Est. Value
About This Home
This home is located at 513 N Meacham Rd, Schaumburg, IL 60173 and is currently estimated at $753,000, approximately $229 per square foot. 513 N Meacham Rd is a home located in Cook County with nearby schools including Fairview Elementary School, Margaret Mead Junior High School, and J B Conant High School.
Ownership History
Date
Name
Owned For
Owner Type
Purchase Details
Closed on
Jun 20, 2016
Sold by
Miller Frank
Bought by
Greco Peter M
Current Estimated Value
Purchase Details
Closed on
Jan 20, 2012
Sold by
Pizzoferrato John
Bought by
Miller Frank
Purchase Details
Closed on
Jul 21, 2011
Sold by
Pnc Mortgage
Bought by
Pizzoferrato John
Purchase Details
Closed on
Nov 9, 2010
Sold by
Nunez Fernando and Nunez Lidia
Bought by
Pnc Mortgage
Purchase Details
Closed on
Jan 29, 2005
Sold by
Husain Faisal and Husain Anjum
Bought by
Nunez Fernando and Nunez Lidia
Home Financials for this Owner
Home Financials are based on the most recent Mortgage that was taken out on this home.
Original Mortgage
$201,000
Interest Rate
5.87%
Mortgage Type
Purchase Money Mortgage
Purchase Details
Closed on
Feb 3, 2004
Sold by
Surebond Inc
Bought by
Husain Faisal and Husain Anjum
Purchase Details
Closed on
Sep 24, 1997
Sold by
Harris Bank Palatine
Bought by
Surebond Inc
Create a Home Valuation Report for This Property
The Home Valuation Report is an in-depth analysis detailing your home's value as well as a comparison with similar homes in the area
Home Values in the Area
Average Home Value in this Area
Purchase History
| Date | Buyer | Sale Price | Title Company |
|---|---|---|---|
| Greco Peter M | -- | Attorney | |
| Miller Frank | -- | None Available | |
| Pizzoferrato John | $75,000 | Premier Title | |
| Pnc Mortgage | -- | None Available | |
| Nunez Fernando | $252,000 | Pntn | |
| Husain Faisal | $140,000 | 1St American Title | |
| Surebond Inc | -- | -- |
Source: Public Records
Mortgage History
| Date | Status | Borrower | Loan Amount |
|---|---|---|---|
| Previous Owner | Nunez Fernando | $201,000 | |
| Previous Owner | Husain Faisal | $320,000 |
Source: Public Records
Tax History Compared to Growth
Tax History
| Year | Tax Paid | Tax Assessment Tax Assessment Total Assessment is a certain percentage of the fair market value that is determined by local assessors to be the total taxable value of land and additions on the property. | Land | Improvement |
|---|---|---|---|---|
| 2024 | $2,405 | $52,500 | $9,226 | $43,274 |
| 2023 | $2,405 | $52,500 | $9,226 | $43,274 |
| 2022 | $2,405 | $8,854 | $8,854 | $0 |
| 2021 | $2,683 | $8,853 | $8,853 | $0 |
| 2020 | $2,637 | $8,853 | $8,853 | $0 |
| 2019 | $2,373 | $8,853 | $8,853 | $0 |
| 2018 | $2,237 | $7,455 | $7,455 | $0 |
| 2017 | $2,202 | $7,455 | $7,455 | $0 |
| 2016 | $2,059 | $7,455 | $7,455 | $0 |
| 2015 | $1,812 | $6,057 | $6,057 | $0 |
| 2014 | $1,792 | $6,057 | $6,057 | $0 |
| 2013 | $1,746 | $6,057 | $6,057 | $0 |
Source: Public Records
Map
Nearby Homes
- 460 Kerri Ct Unit 3A
- 1250 Woodfield Rd
- 515 Verde Dr Unit 12C2
- 10 Nicolette Ave
- 406 Woodcroft Ln
- 1375 Saint Claire Place
- 416 Oakmont Ln
- 54 Egg Harbour Ct
- 1417 Sturgeon Bay Ct
- 101 Bar Harbour Rd Unit 6E
- 735 Shoreline Cir Unit 83B
- 775 Whalom Ln Unit 1A2
- 763 Whalom Ln Unit 2A1
- 218 Deerpath Ct Unit B2
- 217 Arrowwood Ct Unit 512117
- 724 Whitesail Dr Unit 168D
- 713 Mariner Point Unit 5F
- 236 N Waterford Dr Unit 11B
- 226 N Waterford Dr Unit 12D
- 617 Manomet Ct