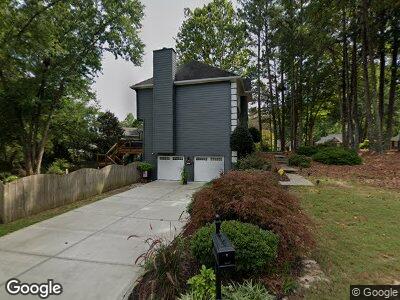
515 Jessup Ct Unit III Alpharetta, GA 30009
Estimated Value: $647,293 - $807,000
4
Beds
3
Baths
2,132
Sq Ft
$332/Sq Ft
Est. Value
About This Home
This home is located at 515 Jessup Ct Unit III, Alpharetta, GA 30009 and is currently estimated at $708,323, approximately $332 per square foot. 515 Jessup Ct Unit III is a home located in Fulton County with nearby schools including Manning Oaks Elementary School, Hopewell Middle School, and Alpharetta High School.
Ownership History
Date
Name
Owned For
Owner Type
Purchase Details
Closed on
May 17, 2023
Sold by
Peek Mary Denise
Bought by
Hannan Mary B
Current Estimated Value
Purchase Details
Closed on
Sep 15, 2000
Sold by
Mcguidwin John A and Mcguidwin Deborah S
Bought by
Hannan Mary B
Home Financials for this Owner
Home Financials are based on the most recent Mortgage that was taken out on this home.
Original Mortgage
$177,400
Interest Rate
8.05%
Mortgage Type
New Conventional
Purchase Details
Closed on
Apr 7, 1998
Sold by
Dehaven Lydia S
Bought by
Stevenson Deborah B
Home Financials for this Owner
Home Financials are based on the most recent Mortgage that was taken out on this home.
Original Mortgage
$84,000
Interest Rate
6.37%
Mortgage Type
New Conventional
Purchase Details
Closed on
Jun 30, 1993
Sold by
Johnson Bruce M Glinda G
Bought by
Dehaven Lydia S
Home Financials for this Owner
Home Financials are based on the most recent Mortgage that was taken out on this home.
Original Mortgage
$119,250
Interest Rate
7.52%
Create a Home Valuation Report for This Property
The Home Valuation Report is an in-depth analysis detailing your home's value as well as a comparison with similar homes in the area
Home Values in the Area
Average Home Value in this Area
Purchase History
| Date | Buyer | Sale Price | Title Company |
|---|---|---|---|
| Hannan Mary B | -- | -- | |
| Hannan Mary B | $186,800 | -- | |
| Stevenson Deborah B | $154,000 | -- | |
| Dehaven Lydia S | $132,500 | -- |
Source: Public Records
Mortgage History
| Date | Status | Borrower | Loan Amount |
|---|---|---|---|
| Previous Owner | Hannan Mary B | $153,422 | |
| Previous Owner | Hannan Mary B | $53,500 | |
| Previous Owner | Hannan Mary B | $180,500 | |
| Previous Owner | Hannan Mary B | $177,400 | |
| Previous Owner | Stevenson Deborah B | $84,000 | |
| Previous Owner | Dehaven Lydia S | $119,250 |
Source: Public Records
Tax History Compared to Growth
Tax History
| Year | Tax Paid | Tax Assessment Tax Assessment Total Assessment is a certain percentage of the fair market value that is determined by local assessors to be the total taxable value of land and additions on the property. | Land | Improvement |
|---|---|---|---|---|
| 2023 | $5,566 | $185,520 | $48,000 | $137,520 |
| 2022 | $2,429 | $168,760 | $32,000 | $136,760 |
| 2021 | $2,812 | $149,120 | $30,240 | $118,880 |
| 2020 | $2,816 | $138,840 | $28,200 | $110,640 |
| 2019 | $391 | $120,240 | $23,040 | $97,200 |
| 2018 | $2,730 | $117,400 | $22,480 | $94,920 |
| 2017 | $2,371 | $94,040 | $21,160 | $72,880 |
| 2016 | $2,358 | $94,040 | $21,160 | $72,880 |
| 2015 | $2,707 | $94,040 | $21,160 | $72,880 |
| 2014 | $2,151 | $82,920 | $18,680 | $64,240 |
Source: Public Records
Map
Nearby Homes
- 1820 N Creek Cir
- 5060 Winship Ct
- 141 Denna Dr
- 350 Jayne Ellen Way
- 2445 Santa Rosa St
- 381 Canton St
- 264 N Main St
- 254 N Main St
- 385 Jayne Ellen Way
- 12103 Windrush Ln
- 0 John Christopher Dr Unit 7455481
- 150 Shady Grove Ln
- 228 Water Oak Place
- 154 Cold Creek Dr
- 151 John Christopher Dr
- 175 Jayne Ellen Way
- 185 Pebble Trail