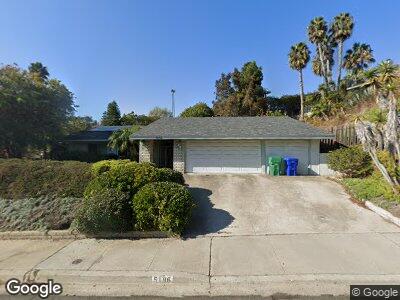
5196 Middleton Rd San Diego, CA 92109
Pacific Beach NeighborhoodEstimated Value: $1,391,000 - $2,007,000
3
Beds
2
Baths
1,626
Sq Ft
$1,091/Sq Ft
Est. Value
About This Home
This home is located at 5196 Middleton Rd, San Diego, CA 92109 and is currently estimated at $1,773,195, approximately $1,090 per square foot. 5196 Middleton Rd is a home located in San Diego County with nearby schools including Sessions Elementary School, Pacific Beach Middle, and Mission Bay High School.
Ownership History
Date
Name
Owned For
Owner Type
Purchase Details
Closed on
Apr 9, 1997
Sold by
Connie Field and Field Stanley 1996 Trust
Bought by
Klausbruckner Michael J and Falsafi Elham
Current Estimated Value
Home Financials for this Owner
Home Financials are based on the most recent Mortgage that was taken out on this home.
Original Mortgage
$216,000
Interest Rate
7.62%
Purchase Details
Closed on
Jun 21, 1996
Sold by
Field Stanley
Bought by
Field Connie and Field Jeff
Purchase Details
Closed on
Jan 5, 1996
Sold by
Field Jeff and Field Connie
Bought by
Field Stanley
Purchase Details
Closed on
Oct 5, 1995
Sold by
Field Stanley
Bought by
Field Stanley and Field Jeff
Purchase Details
Closed on
Mar 13, 1985
Create a Home Valuation Report for This Property
The Home Valuation Report is an in-depth analysis detailing your home's value as well as a comparison with similar homes in the area
Home Values in the Area
Average Home Value in this Area
Purchase History
| Date | Buyer | Sale Price | Title Company |
|---|---|---|---|
| Klausbruckner Michael J | $270,000 | Chicago Title Co | |
| Field Connie | -- | -- | |
| Field Stanley | -- | -- | |
| Field Stanley | -- | -- | |
| -- | $225,000 | -- |
Source: Public Records
Mortgage History
| Date | Status | Borrower | Loan Amount |
|---|---|---|---|
| Closed | Klausbruckner Michael J | $206,527 | |
| Closed | Klausbruckner Michael J | $210,260 | |
| Closed | Klausbruckner Michael J | $15,015 | |
| Closed | Klausbruckner Michael J | $11,076 | |
| Closed | Klausbruckner Michael J | $218,700 | |
| Closed | Klausbruckner Michael J | $216,000 |
Source: Public Records
Tax History Compared to Growth
Tax History
| Year | Tax Paid | Tax Assessment Tax Assessment Total Assessment is a certain percentage of the fair market value that is determined by local assessors to be the total taxable value of land and additions on the property. | Land | Improvement |
|---|---|---|---|---|
| 2024 | $5,243 | $431,096 | $215,548 | $215,548 |
| 2023 | $5,126 | $422,644 | $211,322 | $211,322 |
| 2022 | $4,988 | $414,358 | $207,179 | $207,179 |
| 2021 | $4,952 | $406,234 | $203,117 | $203,117 |
| 2020 | $4,892 | $402,070 | $201,035 | $201,035 |
| 2019 | $4,803 | $394,188 | $197,094 | $197,094 |
| 2018 | $4,490 | $386,460 | $193,230 | $193,230 |
| 2017 | $80 | $378,884 | $189,442 | $189,442 |
| 2016 | $4,309 | $371,456 | $185,728 | $185,728 |
| 2015 | $4,245 | $365,878 | $182,939 | $182,939 |
| 2014 | $4,177 | $358,712 | $179,356 | $179,356 |
Source: Public Records
Map
Nearby Homes
- 5122 Edgeworth Rd
- 2442 Alto Cerro Cir
- 5426 Avenida Fiesta
- 5171 San Aquario Dr
- 2393 La Marque St
- 2427 Dresden Place
- 5468 Pacifica Dr
- 1981 Wilbur Ave
- 2324 Walmar Ln
- 1920 Beryl St
- 5558 Avenida Fiesta
- 4887 Randall St
- 4801 Academy St Unit 13
- 4922 Pacifica Dr
- 1964 Chalcedony St Unit 4
- 4964 Kendall St
- 4750 Noyes St Unit 123
- 4750 Noyes St Unit 113
- 5108 Gordon Ln
- 1779 Collingwood Dr