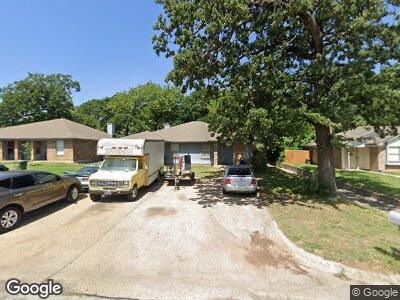
522 Mcqueary St Arlington, TX 76012
Estimated Value: $299,900 - $361,000
4
Beds
2
Baths
2,094
Sq Ft
$155/Sq Ft
Est. Value
About This Home
This home is located at 522 Mcqueary St, Arlington, TX 76012 and is currently estimated at $324,725, approximately $155 per square foot. 522 Mcqueary St is a home located in Tarrant County with nearby schools including Shackelford J High School, Lamar High School, and Country Day School of Arlington.
Ownership History
Date
Name
Owned For
Owner Type
Purchase Details
Closed on
Aug 15, 2016
Sold by
J & S Nguyen Family Limited Partnership
Bought by
Cruz Jose A
Current Estimated Value
Home Financials for this Owner
Home Financials are based on the most recent Mortgage that was taken out on this home.
Original Mortgage
$119,000
Outstanding Balance
$61,249
Interest Rate
3.48%
Mortgage Type
Seller Take Back
Estimated Equity
$237,661
Purchase Details
Closed on
Oct 24, 2011
Sold by
Nguyen Joseph L and Nguyen Susan H
Bought by
J & S Nguyen Family Limited Partnership
Purchase Details
Closed on
Mar 14, 2001
Sold by
Mullanax Milton Gayle and Mullanax Sharon
Bought by
Nguyen Joseph and Nguyen Susan
Home Financials for this Owner
Home Financials are based on the most recent Mortgage that was taken out on this home.
Original Mortgage
$66,000
Interest Rate
7.1%
Mortgage Type
Seller Take Back
Create a Home Valuation Report for This Property
The Home Valuation Report is an in-depth analysis detailing your home's value as well as a comparison with similar homes in the area
Home Values in the Area
Average Home Value in this Area
Purchase History
| Date | Buyer | Sale Price | Title Company |
|---|---|---|---|
| Cruz Jose A | -- | None Available | |
| J & S Nguyen Family Limited Partnership | -- | None Available | |
| Nguyen Joseph | -- | -- |
Source: Public Records
Mortgage History
| Date | Status | Borrower | Loan Amount |
|---|---|---|---|
| Open | Cruz Jose A | $119,000 | |
| Previous Owner | Nguyen Joseph | $66,000 |
Source: Public Records
Tax History Compared to Growth
Tax History
| Year | Tax Paid | Tax Assessment Tax Assessment Total Assessment is a certain percentage of the fair market value that is determined by local assessors to be the total taxable value of land and additions on the property. | Land | Improvement |
|---|---|---|---|---|
| 2024 | $6,487 | $296,822 | $12,000 | $284,822 |
| 2023 | $5,753 | $260,724 | $12,000 | $248,724 |
| 2022 | $6,114 | $245,824 | $12,000 | $233,824 |
| 2021 | $5,490 | $211,289 | $12,000 | $199,289 |
| 2020 | $4,596 | $183,000 | $12,000 | $171,000 |
| 2019 | $4,754 | $183,000 | $12,000 | $171,000 |
| 2018 | $4,135 | $159,145 | $12,000 | $147,145 |
| 2017 | $2,697 | $101,336 | $12,000 | $89,336 |
| 2016 | $2,354 | $88,458 | $12,000 | $76,458 |
| 2015 | $2,266 | $85,900 | $12,000 | $73,900 |
| 2014 | $2,266 | $85,900 | $12,000 | $73,900 |
Source: Public Records
Map
Nearby Homes
- 1905 Dogwood Dr
- 302 Westview Terrace
- 326 Westview Terrace
- 614 Raintree Ct
- 402 S Fielder Rd
- 364 Westview Terrace
- 709 Castlewood Ln
- 406 Dorcas Ln
- 409 Bryce Ln
- 2221 W Sanford St
- 1608 Pecan Chase Cir Unit 34
- 1608 Pecan Chase Cir Unit 39
- 1618 Pecan Chase Cir Unit 84
- 1614 Pecan Chase Cir Unit 49
- 1310 W Cedar St
- 905 Kristin Ct
- 2338 Kingsway Dr
- 2340 Kingsway Dr
- 702 Vail Dr
- 2000 Pecandale Dr