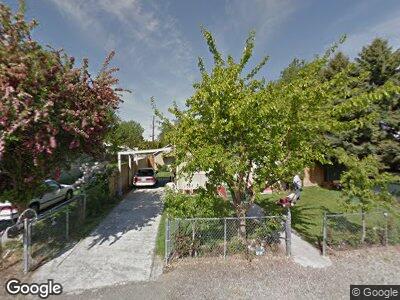
523 N Kent St Kennewick, WA 99336
Bridge to Bridge NeighborhoodEstimated Value: $221,000 - $282,000
3
Beds
1
Bath
606
Sq Ft
$404/Sq Ft
Est. Value
About This Home
This home is located at 523 N Kent St, Kennewick, WA 99336 and is currently estimated at $244,954, approximately $404 per square foot. 523 N Kent St is a home located in Benton County with nearby schools including Amistad Elementary School, Park Middle School, and Kennewick High School.
Create a Home Valuation Report for This Property
The Home Valuation Report is an in-depth analysis detailing your home's value as well as a comparison with similar homes in the area
Home Values in the Area
Average Home Value in this Area
Tax History Compared to Growth
Tax History
| Year | Tax Paid | Tax Assessment Tax Assessment Total Assessment is a certain percentage of the fair market value that is determined by local assessors to be the total taxable value of land and additions on the property. | Land | Improvement |
|---|---|---|---|---|
| 2024 | $1,535 | $170,130 | $70,000 | $100,130 |
| 2023 | $1,535 | $156,770 | $70,000 | $86,770 |
| 2022 | $1,246 | $136,750 | $70,000 | $66,750 |
| 2021 | $1,117 | $102,710 | $40,000 | $62,710 |
| 2020 | $1,147 | $89,350 | $22,000 | $67,350 |
| 2019 | $1,014 | $89,350 | $22,000 | $67,350 |
| 2018 | $1,050 | $78,670 | $22,000 | $56,670 |
| 2017 | $964 | $68,450 | $22,000 | $46,450 |
| 2016 | -- | $68,450 | $22,000 | $46,450 |
| 2015 | $947 | $66,450 | $15,000 | $51,450 |
| 2014 | -- | $66,450 | $15,000 | $51,450 |
| 2013 | -- | $66,450 | $15,000 | $51,450 |
Source: Public Records
Map
Nearby Homes
- 514 N Kent Place
- 502 N Lyle St
- 508 N Hartford St
- 3051 Southgate Way
- 627 N Everett St
- 1609 W Clearwater Ave
- 2 N Palouse St
- 519 W Albany Ave
- 217 S Quincy St
- 411 W 1st Ave
- 214 S Quincy St
- 218 S Quincy St
- 1614 W 4th Ave
- 224 W 2nd Ave
- 109 N Waverly Place Unit H
- 2401 W Canal Dr
- 1614 W 6th Ave Unit A & B
- 4 W 3rd Ave
- 2501 W Canal Dr
- 2507 W Entiat Ave