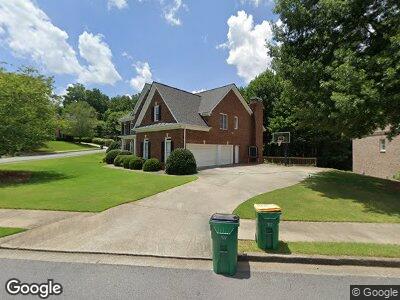
530 Guildhall Place Unit 525 Alpharetta, GA 30022
Newtown NeighborhoodEstimated Value: $945,437 - $1,066,000
6
Beds
5
Baths
3,846
Sq Ft
$261/Sq Ft
Est. Value
About This Home
This home is located at 530 Guildhall Place Unit 525, Alpharetta, GA 30022 and is currently estimated at $1,004,609, approximately $261 per square foot. 530 Guildhall Place Unit 525 is a home located in Fulton County with nearby schools including Hillside Elementary School, Haynes Bridge Middle School, and Centennial High School.
Ownership History
Date
Name
Owned For
Owner Type
Purchase Details
Closed on
Jul 10, 2014
Sold by
Langa Thomas M
Bought by
Hipp Larry and Hipp Kathryn
Current Estimated Value
Home Financials for this Owner
Home Financials are based on the most recent Mortgage that was taken out on this home.
Original Mortgage
$320,000
Interest Rate
4.26%
Mortgage Type
New Conventional
Purchase Details
Closed on
Mar 29, 1999
Sold by
Hickel Construction
Bought by
Langa Michelle E and Langa Thomas M
Home Financials for this Owner
Home Financials are based on the most recent Mortgage that was taken out on this home.
Original Mortgage
$371,400
Interest Rate
7.5%
Mortgage Type
New Conventional
Create a Home Valuation Report for This Property
The Home Valuation Report is an in-depth analysis detailing your home's value as well as a comparison with similar homes in the area
Home Values in the Area
Average Home Value in this Area
Purchase History
| Date | Buyer | Sale Price | Title Company |
|---|---|---|---|
| Hipp Larry | $470,000 | -- | |
| Langa Michelle E | $383,900 | -- |
Source: Public Records
Mortgage History
| Date | Status | Borrower | Loan Amount |
|---|---|---|---|
| Open | Hipp Family Living Trust | $125,000 | |
| Open | Hipp Larry | $330,724 | |
| Closed | Hipp Larry | $57,000 | |
| Closed | Hipp Larry | $320,000 | |
| Previous Owner | Langa Michelle E | $397,776 | |
| Previous Owner | Langa Thomas M | $389,000 | |
| Previous Owner | Langa Thomas M | $381,000 | |
| Previous Owner | Langa Michelle E | $380,400 | |
| Previous Owner | Langa Michelle E | $371,400 |
Source: Public Records
Tax History Compared to Growth
Tax History
| Year | Tax Paid | Tax Assessment Tax Assessment Total Assessment is a certain percentage of the fair market value that is determined by local assessors to be the total taxable value of land and additions on the property. | Land | Improvement |
|---|---|---|---|---|
| 2023 | $5,922 | $310,800 | $126,840 | $183,960 |
| 2022 | $5,683 | $278,480 | $66,040 | $212,440 |
| 2021 | $5,629 | $239,240 | $50,400 | $188,840 |
| 2020 | $5,670 | $233,760 | $55,200 | $178,560 |
| 2019 | $689 | $207,240 | $47,480 | $159,760 |
| 2018 | $5,913 | $202,400 | $46,360 | $156,040 |
| 2017 | $5,590 | $178,600 | $35,720 | $142,880 |
| 2016 | $5,476 | $178,600 | $35,720 | $142,880 |
| 2015 | $5,535 | $178,600 | $35,720 | $142,880 |
| 2014 | $5,960 | $169,000 | $26,720 | $142,280 |
Source: Public Records
Map
Nearby Homes
- 3000 Leeds Garden Ln
- 2870 Abbottswell Dr
- 3045 Hartridge Dr
- 515 Old Chartwell Crossing
- 635 Holyrood Way
- 9770 Rod Rd
- 315 Chandon Place Ct
- 2885 Arborwoods Dr
- 9425 Nesbit Ferry Rd
- 160 Arden Place
- 3060 Birchton St
- 3213 Arborwoods Dr
- 230 Winnipeg Ln
- 3105 Birchton St Unit 1
- 815 Kings Arms Way Unit IV
- 3015 Ascot Ln
- 2055 Pearwood Path Unit 2
- 940 Waters Reach Ct