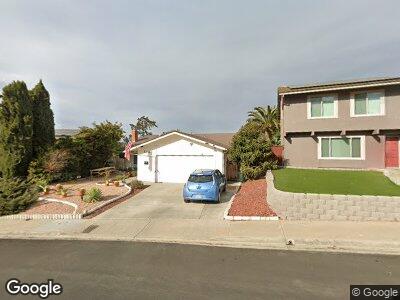
5332 Mount Burnham Dr San Diego, CA 92111
Clairemont Mesa West NeighborhoodEstimated Value: $1,178,000 - $1,595,000
9
Beds
4
Baths
2,736
Sq Ft
$505/Sq Ft
Est. Value
About This Home
This home is located at 5332 Mount Burnham Dr, San Diego, CA 92111 and is currently estimated at $1,382,945, approximately $505 per square foot. 5332 Mount Burnham Dr is a home located in San Diego County with nearby schools including Holmes Elementary, Marston Middle School, and Clairemont High School.
Ownership History
Date
Name
Owned For
Owner Type
Purchase Details
Closed on
Apr 9, 2019
Sold by
Espinosa Leo Ellis and Espinosa Glenit J
Bought by
Espinosa Family Trust
Current Estimated Value
Purchase Details
Closed on
Apr 6, 2018
Sold by
Ibayan Milagros F and Ibayan Trixie F
Bought by
Espinosa Ii Leo Ellis and Espinosa Glenit J
Home Financials for this Owner
Home Financials are based on the most recent Mortgage that was taken out on this home.
Original Mortgage
$581,250
Interest Rate
4.5%
Mortgage Type
New Conventional
Purchase Details
Closed on
Dec 15, 2010
Sold by
Heinla Cheryl L
Bought by
Ibayan Gregorio M and Ibayan Milagros F
Purchase Details
Closed on
Jun 4, 2003
Sold by
Rich Glenn K
Bought by
Rich Glenn K
Purchase Details
Closed on
Dec 1, 1989
Create a Home Valuation Report for This Property
The Home Valuation Report is an in-depth analysis detailing your home's value as well as a comparison with similar homes in the area
Home Values in the Area
Average Home Value in this Area
Purchase History
| Date | Buyer | Sale Price | Title Company |
|---|---|---|---|
| Espinosa Family Trust | -- | None Available | |
| Espinosa Ii Leo Ellis | $775,000 | First American Title Insuran | |
| Ibayan Gregorio M | $375,000 | Corinthian Title Company | |
| Rich Glenn K | -- | -- | |
| -- | $237,500 | -- |
Source: Public Records
Mortgage History
| Date | Status | Borrower | Loan Amount |
|---|---|---|---|
| Open | Espinosa Leo Ellis | $670,000 | |
| Previous Owner | Espinosa Ii Leo Ellis | $581,250 | |
| Previous Owner | Rich Glenn K | $227,100 |
Source: Public Records
Tax History Compared to Growth
Tax History
| Year | Tax Paid | Tax Assessment Tax Assessment Total Assessment is a certain percentage of the fair market value that is determined by local assessors to be the total taxable value of land and additions on the property. | Land | Improvement |
|---|---|---|---|---|
| 2024 | $10,652 | $864,522 | $564,588 | $299,934 |
| 2023 | $10,417 | $847,571 | $553,518 | $294,053 |
| 2022 | $10,140 | $830,953 | $542,665 | $288,288 |
| 2021 | $10,071 | $814,661 | $532,025 | $282,636 |
| 2020 | $9,949 | $806,308 | $526,570 | $279,738 |
| 2019 | $9,772 | $790,499 | $516,246 | $274,253 |
| 2018 | $6,431 | $551,726 | $360,312 | $191,414 |
| 2017 | $6,277 | $540,909 | $353,248 | $187,661 |
| 2016 | $6,175 | $530,304 | $346,322 | $183,982 |
| 2015 | $6,083 | $522,339 | $341,120 | $181,219 |
| 2014 | $5,986 | $512,108 | $334,438 | $177,670 |
Source: Public Records
Map
Nearby Homes
- 3567 Mount Everest Blvd
- 4870 Mount Armour Dr
- 3635 Mount Abbey Ave
- 4711 Mount Ashmun Dr
- 3705 Old Cobble Rd
- 3164 W Fox Run Way
- 3134 W Fox Run Way
- 3111 Old Bridgeport Way
- 3987 Canning Ave
- 2930 Cowley Way Unit 101
- 2915 Cowley Way Unit A
- 4089 Mount Everest Blvd
- 3833 Tomahawk Ln
- 4751 Misty Place
- 4654-56 Blackfoot Ave
- 4521 Misty Place
- 4821 Iroquois Ave
- 2750 Wheatstone St Unit 22
- 2750 Wheatstone St Unit 207
- 2750 Wheatstone St