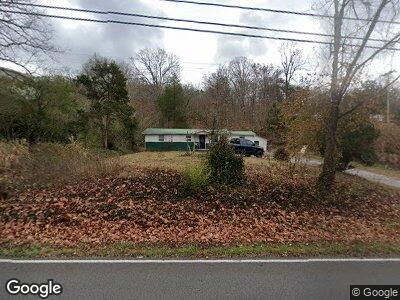
535 Mehaffey Rd Powell, TN 37849
South Clinton NeighborhoodEstimated Value: $98,000 - $222,000
--
Bed
1
Bath
888
Sq Ft
$190/Sq Ft
Est. Value
About This Home
This home is located at 535 Mehaffey Rd, Powell, TN 37849 and is currently estimated at $169,143, approximately $190 per square foot. 535 Mehaffey Rd is a home located in Anderson County.
Ownership History
Date
Name
Owned For
Owner Type
Purchase Details
Closed on
Oct 15, 2018
Sold by
Metcalf Ruby A and Estate Of Ray L Metcalf
Bought by
Baloga Jonathon Colby
Current Estimated Value
Purchase Details
Closed on
Oct 5, 2001
Sold by
Brice Philip T
Bought by
Metcalf Ray
Create a Home Valuation Report for This Property
The Home Valuation Report is an in-depth analysis detailing your home's value as well as a comparison with similar homes in the area
Home Values in the Area
Average Home Value in this Area
Purchase History
| Date | Buyer | Sale Price | Title Company |
|---|---|---|---|
| Baloga Jonathon Colby | $40,000 | None Available | |
| Metcalf Ray | $40,000 | -- |
Source: Public Records
Mortgage History
| Date | Status | Borrower | Loan Amount |
|---|---|---|---|
| Open | Baloga Jonathon Colby | $160,000 |
Source: Public Records
Tax History Compared to Growth
Tax History
| Year | Tax Paid | Tax Assessment Tax Assessment Total Assessment is a certain percentage of the fair market value that is determined by local assessors to be the total taxable value of land and additions on the property. | Land | Improvement |
|---|---|---|---|---|
| 2024 | $517 | $19,650 | $11,075 | $8,575 |
| 2023 | $517 | $19,650 | $0 | $0 |
| 2022 | $517 | $19,650 | $11,075 | $8,575 |
| 2021 | $517 | $19,650 | $11,075 | $8,575 |
| 2020 | $536 | $19,650 | $11,075 | $8,575 |
| 2019 | $555 | $19,200 | $11,075 | $8,125 |
| 2018 | $504 | $19,200 | $11,075 | $8,125 |
| 2017 | $504 | $18,050 | $11,075 | $6,975 |
| 2016 | $504 | $18,050 | $11,075 | $6,975 |
| 2015 | -- | $18,050 | $11,075 | $6,975 |
| 2014 | -- | $18,050 | $11,075 | $6,975 |
| 2013 | -- | $18,275 | $0 | $0 |
Source: Public Records
Map
Nearby Homes
- 329 Mehaffey Rd
- 236 Bull Run Rd
- 126 Turkey Rd
- 0 Cate Rd
- 185 Blacksferry Rd
- 124 Grey Dove Ln
- 222 Moosetrail Ln
- 110 Dream Catcher Ln
- 6325 MacKlin Bend Way
- 5136 Cates Bend Way
- 5029 Travis Powell Ln
- 7700 Greengable Ln
- 5724 Attleboro Dr
- 161 Bostie Marie Ln
- 7505 Blacks Ferry Rd
- 6629 Hugh Willis Rd
- 5605 Glenlyn Dr
- 7534 Julesburg Way Unit 68
- 5606 Bridgehampton Dr
- 7629 Saint Baron Way Unit 27