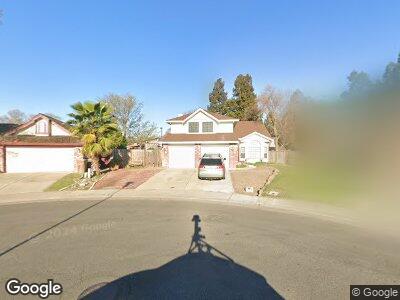
5353 Spring Creek Way Elk Grove, CA 95758
North West Elk Grove NeighborhoodEstimated Value: $584,000 - $659,210
4
Beds
3
Baths
2,147
Sq Ft
$294/Sq Ft
Est. Value
About This Home
This home is located at 5353 Spring Creek Way, Elk Grove, CA 95758 and is currently estimated at $630,303, approximately $293 per square foot. 5353 Spring Creek Way is a home located in Sacramento County with nearby schools including Foulks Ranch Elementary School, Harriet G. Eddy Middle School, and Laguna Creek High School.
Ownership History
Date
Name
Owned For
Owner Type
Purchase Details
Closed on
Feb 23, 2023
Sold by
Maestretti Joseph T
Bought by
Joseph Timothy Maestretti And Rosemary Maestr
Current Estimated Value
Purchase Details
Closed on
Apr 28, 1994
Sold by
Radian Corp
Bought by
Maestretti Joseph T and Maestretti Rosemary
Home Financials for this Owner
Home Financials are based on the most recent Mortgage that was taken out on this home.
Original Mortgage
$149,850
Interest Rate
7.84%
Purchase Details
Closed on
Mar 30, 1994
Sold by
Nelson Lawrence P and Nelson Catherine P
Bought by
Radian Corp
Home Financials for this Owner
Home Financials are based on the most recent Mortgage that was taken out on this home.
Original Mortgage
$149,850
Interest Rate
7.84%
Create a Home Valuation Report for This Property
The Home Valuation Report is an in-depth analysis detailing your home's value as well as a comparison with similar homes in the area
Home Values in the Area
Average Home Value in this Area
Purchase History
| Date | Buyer | Sale Price | Title Company |
|---|---|---|---|
| Joseph Timothy Maestretti And Rosemary Maestr | -- | -- | |
| Maestretti Joseph T | $166,500 | Fidelity National Title | |
| Radian Corp | $179,000 | Fidelity National Title Ins |
Source: Public Records
Mortgage History
| Date | Status | Borrower | Loan Amount |
|---|---|---|---|
| Previous Owner | Maestretti Joseph T | $71,835 | |
| Previous Owner | Maestretti Joseph T | $93,149 | |
| Previous Owner | Maestretti Joseph T | $99,963 | |
| Previous Owner | Maestretti Joseph T | $149,850 |
Source: Public Records
Tax History Compared to Growth
Tax History
| Year | Tax Paid | Tax Assessment Tax Assessment Total Assessment is a certain percentage of the fair market value that is determined by local assessors to be the total taxable value of land and additions on the property. | Land | Improvement |
|---|---|---|---|---|
| 2024 | $3,362 | $277,414 | $74,968 | $202,446 |
| 2023 | $3,267 | $271,976 | $73,499 | $198,477 |
| 2022 | $3,213 | $266,644 | $72,058 | $194,586 |
| 2021 | $3,147 | $261,417 | $70,646 | $190,771 |
| 2020 | $3,100 | $258,737 | $69,922 | $188,815 |
| 2019 | $3,114 | $253,664 | $68,551 | $185,113 |
| 2018 | $3,031 | $248,691 | $67,207 | $181,484 |
| 2017 | $2,899 | $243,816 | $65,890 | $177,926 |
| 2016 | $2,767 | $239,037 | $64,599 | $174,438 |
| 2015 | $2,711 | $235,447 | $63,629 | $171,818 |
| 2014 | $2,675 | $230,836 | $62,383 | $168,453 |
Source: Public Records
Map
Nearby Homes
- 9152 Sage Glen Way
- 5201 Laguna Oaks Dr Unit 174
- 9321 Edensbury Ct
- 5817 Sparrow Hawk Ct
- 5847 Laguna Trail Way
- 5840 Laguna Shore Way
- 5420 Laguna Park Dr
- 6721 Paseo Del Sol Way
- 5214 Laguna Park Dr
- 9425 S Wales Way
- 5917 Pine Vista Way
- 9005 Chaff Ct
- 9200 Adelante Ct
- 6105 Pine Vista Way
- 6104 Pine Vista Way
- 5026 Opal Creek Ct
- 4512 Laguna Way W
- 6314 Shasta Creek Way
- 9015 Stinson Beach Way
- 6335 Shasta Creek Way