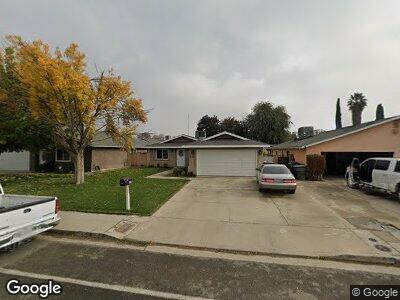
536 S West St Tulare, CA 93274
Tulare Southwest NeighborhoodEstimated Value: $212,000 - $274,000
3
Beds
2
Baths
1,100
Sq Ft
$215/Sq Ft
Est. Value
About This Home
This home is located at 536 S West St, Tulare, CA 93274 and is currently estimated at $236,881, approximately $215 per square foot. 536 S West St is a home located in Tulare County with nearby schools including Roosevelt Elementary School, Mulcahy Middle School, and Tulare Union High School.
Ownership History
Date
Name
Owned For
Owner Type
Purchase Details
Closed on
Apr 26, 2021
Sold by
Da Silva Christina M
Bought by
Da Silva George
Current Estimated Value
Home Financials for this Owner
Home Financials are based on the most recent Mortgage that was taken out on this home.
Original Mortgage
$120,000
Outstanding Balance
$110,664
Interest Rate
3%
Mortgage Type
New Conventional
Estimated Equity
$131,000
Purchase Details
Closed on
Apr 13, 2021
Sold by
Osvaldo And Estela Avila Family Trust and Silva Paul
Bought by
Da Silva George
Home Financials for this Owner
Home Financials are based on the most recent Mortgage that was taken out on this home.
Original Mortgage
$120,000
Outstanding Balance
$110,664
Interest Rate
3%
Mortgage Type
New Conventional
Estimated Equity
$131,000
Purchase Details
Closed on
Jan 18, 2021
Sold by
Avila Osvaldo Marques
Bought by
Osvaldo And Estela Avila Family Trust
Purchase Details
Closed on
Apr 16, 2003
Sold by
Avila Estela J
Bought by
Avila Osvaldo M
Purchase Details
Closed on
Jan 22, 2003
Sold by
Avila Joe S
Bought by
Avila Osvaldo M and Avila Estela J
Create a Home Valuation Report for This Property
The Home Valuation Report is an in-depth analysis detailing your home's value as well as a comparison with similar homes in the area
Home Values in the Area
Average Home Value in this Area
Purchase History
| Date | Buyer | Sale Price | Title Company |
|---|---|---|---|
| Da Silva George | -- | Chicago Title | |
| Da Silva George | $140,000 | Chicago Title | |
| Avila Osvaldo M | -- | -- | |
| Avila Osvaldo M | $82,000 | Fidelity National Title Co |
Source: Public Records
Mortgage History
| Date | Status | Borrower | Loan Amount |
|---|---|---|---|
| Open | Da Silva George | $120,000 |
Source: Public Records
Tax History Compared to Growth
Tax History
| Year | Tax Paid | Tax Assessment Tax Assessment Total Assessment is a certain percentage of the fair market value that is determined by local assessors to be the total taxable value of land and additions on the property. | Land | Improvement |
|---|---|---|---|---|
| 2024 | $1,649 | $148,568 | $37,142 | $111,426 |
| 2023 | $1,607 | $145,656 | $36,414 | $109,242 |
| 2022 | $1,561 | $142,800 | $35,700 | $107,100 |
| 2021 | $1,207 | $109,719 | $26,760 | $82,959 |
| 2020 | $1,227 | $108,594 | $26,486 | $82,108 |
| 2019 | $1,258 | $106,465 | $25,967 | $80,498 |
| 2018 | $1,238 | $104,378 | $25,458 | $78,920 |
| 2017 | $1,227 | $102,332 | $24,959 | $77,373 |
| 2016 | $1,173 | $100,326 | $24,470 | $75,856 |
| 2015 | $1,134 | $98,819 | $24,102 | $74,717 |
| 2014 | $1,134 | $96,883 | $23,630 | $73,253 |
Source: Public Records
Map
Nearby Homes
- 538 S Santa Clara St
- 396 S Mendocino St
- 396 Mendocino St
- 614 Potomac St
- 678 Potomac St
- 1719 Glory Ave
- 0 W Inyo Ave
- 1789 Union Ave
- 1802 Union Ave
- 1811 Union Ave
- 1824 Union Ave
- 1836 Union Ave
- 942 Maricopa St
- 1858 Union Ave
- 1867 Union Ave
- 1901 Union Ave
- 1923 Union Ave
- 1945 Union Ave
- 659 S Pratt St
- 630 S Pratt St