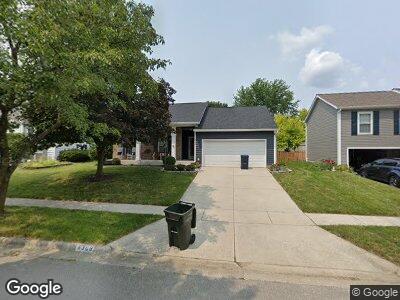
5368 Burwash Landing Hilliard, OH 43026
Estimated Value: $332,453 - $368,000
3
Beds
2
Baths
1,460
Sq Ft
$239/Sq Ft
Est. Value
About This Home
This home is located at 5368 Burwash Landing, Hilliard, OH 43026 and is currently estimated at $349,113, approximately $239 per square foot. 5368 Burwash Landing is a home located in Franklin County with nearby schools including Avery Elementary School, Hilliard Tharp Sixth Grade Elementary School, and Hilliard Weaver Middle School.
Ownership History
Date
Name
Owned For
Owner Type
Purchase Details
Closed on
Apr 1, 2004
Sold by
Jone Kelly J and Jones Jeffrey A
Bought by
Jones Jeffrey A and Jones Kelly J
Current Estimated Value
Home Financials for this Owner
Home Financials are based on the most recent Mortgage that was taken out on this home.
Original Mortgage
$142,595
Interest Rate
4.92%
Mortgage Type
Purchase Money Mortgage
Purchase Details
Closed on
Jun 27, 2001
Sold by
Allen James R and Allen Antionette
Bought by
Donelson Kelly J and Jones Jeffrey A
Home Financials for this Owner
Home Financials are based on the most recent Mortgage that was taken out on this home.
Original Mortgage
$141,450
Interest Rate
7.18%
Purchase Details
Closed on
Oct 11, 1988
Bought by
Allen James R
Purchase Details
Closed on
Aug 10, 1987
Purchase Details
Closed on
Feb 25, 1987
Create a Home Valuation Report for This Property
The Home Valuation Report is an in-depth analysis detailing your home's value as well as a comparison with similar homes in the area
Home Values in the Area
Average Home Value in this Area
Purchase History
| Date | Buyer | Sale Price | Title Company |
|---|---|---|---|
| Jones Jeffrey A | -- | -- | |
| Donelson Kelly J | $148,900 | Midland Celtic Title | |
| Allen James R | $90,000 | -- | |
| -- | $83,000 | -- | |
| -- | -- | -- |
Source: Public Records
Mortgage History
| Date | Status | Borrower | Loan Amount |
|---|---|---|---|
| Open | Jones Jeffrey A | $160,000 | |
| Closed | Jones Kelly J | $71,413 | |
| Closed | Jones Jeffrey A | $142,595 | |
| Closed | Donelson Kelly J | $141,450 |
Source: Public Records
Tax History Compared to Growth
Tax History
| Year | Tax Paid | Tax Assessment Tax Assessment Total Assessment is a certain percentage of the fair market value that is determined by local assessors to be the total taxable value of land and additions on the property. | Land | Improvement |
|---|---|---|---|---|
| 2024 | $5,908 | $88,200 | $29,470 | $58,730 |
| 2023 | $4,810 | $88,200 | $29,470 | $58,730 |
| 2022 | $4,339 | $63,320 | $17,400 | $45,920 |
| 2021 | $4,337 | $63,320 | $17,400 | $45,920 |
| 2020 | $4,326 | $63,320 | $17,400 | $45,920 |
| 2019 | $4,223 | $52,610 | $14,490 | $38,120 |
| 2018 | $4,263 | $52,610 | $14,490 | $38,120 |
| 2017 | $4,207 | $52,610 | $14,490 | $38,120 |
| 2016 | $4,572 | $52,920 | $12,600 | $40,320 |
| 2015 | $4,318 | $52,920 | $12,600 | $40,320 |
| 2014 | $4,325 | $52,920 | $12,600 | $40,320 |
| 2013 | $2,091 | $50,400 | $12,005 | $38,395 |
Source: Public Records
Map
Nearby Homes
- 4902 Diplomat Way
- 4812 Diplomat Way
- 4926 Diplomat Way
- 5614 Eventing Way
- 5560 Eventing Way Unit 46
- 4826 Lady Jane Ave
- 4843 Edison St
- 5244 Davidson Rd
- 4714 Champion Ln
- 5678 Arcadian Ave
- 5647 Embassy Dr
- 5755 Arcadian Ave
- 5755 Arcadian Ave
- 5755 Arcadian Ave
- 5755 Arcadian Ave
- 5755 Arcadian Ave
- 5755 Arcadian Ave
- 5755 Arcadian Ave
- 5755 Arcadian Ave
- 5629 Aristocrat Dr