N
Seller's Agent in 2025
NIANG CING
FLORIDA HOMES REALTY & MTG LLC
(904) 720-7964
4 Total Sales
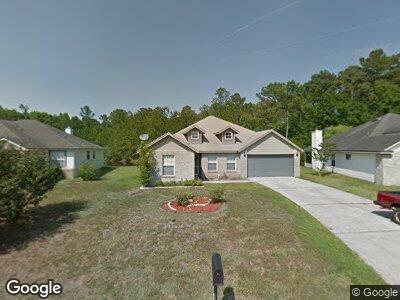
This 4-bedroom, 2-bathroom home FOR RENT, features a range of impressive upgrades. With 1,890 square feet of living space, this property showcases sleek, modern countertops and elegant tile flooring in both the kitchen and living areas. The split-bedroom layout ensures privacy and comfort, making it ideal for families or guests. The kitchen has been beautifully remodeled, while the bathrooms have been tastefully updated. Outside, you'll find a professionally renovated back deck, perfect for unwinding or entertaining. There's also a charming covered patio with beautiful brick flooring and a built-in BBQ area, creating an inviting space for hosting friends and family. This home is a rare gem in a fantastic location and move in ready!
| Date | Buyer | Sale Price | Title Company |
|---|---|---|---|
| Pham Michael | $290,000 | Wesley Chapel Title |
| Date | Status | Borrower | Loan Amount |
|---|---|---|---|
| Open | Pham Michael | $200,000 | |
| Previous Owner | Davis Charles A | $242,572 | |
| Previous Owner | Davis Charles A | $193,171 | |
| Previous Owner | Davis Charles A | $141,570 |
| Date | Event | Price | Change | Sq Ft Price |
|---|---|---|---|---|
| 02/15/2025 02/15/25 | Rented | $1,900 | 0.0% | -- |
| 01/21/2025 01/21/25 | Under Contract | -- | -- | -- |
| 01/20/2025 01/20/25 | Off Market | $1,900 | -- | -- |
| 01/13/2025 01/13/25 | Price Changed | $1,900 | -13.6% | $1 / Sq Ft |
| 12/26/2024 12/26/24 | Price Changed | $2,200 | -4.3% | $1 / Sq Ft |
| 12/14/2024 12/14/24 | For Rent | $2,300 | 0.0% | -- |
| 11/01/2024 11/01/24 | Sold | $290,000 | -4.9% | $154 / Sq Ft |
| 09/26/2024 09/26/24 | Pending | -- | -- | -- |
| 09/18/2024 09/18/24 | Price Changed | $305,000 | -6.2% | $161 / Sq Ft |
| 08/24/2024 08/24/24 | For Sale | $325,000 | -- | $172 / Sq Ft |
| Year | Tax Paid | Tax Assessment Tax Assessment Total Assessment is a certain percentage of the fair market value that is determined by local assessors to be the total taxable value of land and additions on the property. | Land | Improvement |
|---|---|---|---|---|
| 2024 | $1,378 | $112,116 | -- | -- |
| 2023 | $1,378 | $108,851 | $0 | $0 |
| 2022 | $1,218 | $105,681 | $0 | $0 |
| 2021 | $1,213 | $102,603 | $0 | $0 |
| 2020 | $1,178 | $101,187 | $0 | $0 |
| 2019 | $1,155 | $98,913 | $0 | $0 |
| 2018 | $1,050 | $97,069 | $0 | $0 |
| 2017 | $1,040 | $95,072 | $0 | $0 |
| 2016 | $1,034 | $93,117 | $0 | $0 |
| 2015 | $1,069 | $92,470 | $0 | $0 |
| 2014 | $1,041 | $91,736 | $0 | $0 |
N
Seller's Agent in 2025
NIANG CING
FLORIDA HOMES REALTY & MTG LLC
(904) 720-7964
4 Total Sales

Seller's Agent in 2024
David Giampietri
REALTY ONE GROUP INSPIRATION
(941) 405-0330
1 in this area
48 Total Sales
E
Buyer's Agent in 2024
Elizabeth Pham
BHHS FLORIDA PROPERTIES GROUP
(813) 388-8363
1 in this area
6 Total Sales