
Seller's Agent in 2023
Lin Zhu
Coldwell Banker Realty - Lexington
(339) 203-7199
3 in this area
96 Total Sales
Estimated Value: $581,000 - $654,000
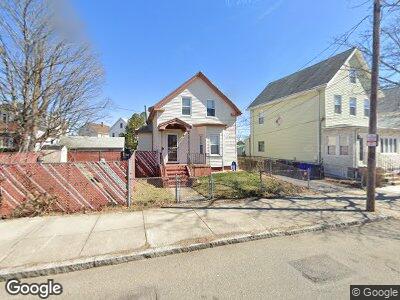
Fantastic opportunity to own a beautiful single-family home located in Malden.This home featuring 3 bedrooms 2 bathrooms plus a bonus room has been recently renovated to a high standard, also new roof and windows.The first level have large living room, the bonus room could be used as an office or guest room, new stainless-steel appliances in kitchen, and a full bathroom. On the second floor, you'll find 3 bedrooms, and 1 bathroom with standing shower.The partially finished basement provides additional space for a workshop, storage or family entertainment.The flat fenced lot on the side of property offers outdoor entertainment. This property offers each access to both Maplewood Square and Malden’s thriving center, plus nearby the bus to town or Malden Center T, major transportation routes and the Northern Strand Trail, walking distance to Broadway Plaza, Close to Route 1, Parks, shops etc.
| Date | Status | Borrower | Loan Amount |
|---|---|---|---|
| Closed | Anand Celine M | $496,000 | |
| Closed | Benedetti Orlando P | $17,136 |
| Date | Event | Price | Change | Sq Ft Price |
|---|---|---|---|---|
| 11/20/2023 11/20/23 | Sold | $620,000 | -1.4% | $507 / Sq Ft |
| 10/24/2023 10/24/23 | Pending | -- | -- | -- |
| 10/18/2023 10/18/23 | Price Changed | $629,000 | -7.4% | $514 / Sq Ft |
| 10/12/2023 10/12/23 | For Sale | $679,000 | +63.2% | $555 / Sq Ft |
| 10/31/2022 10/31/22 | Sold | $416,000 | +4.0% | $340 / Sq Ft |
| 09/29/2022 09/29/22 | Pending | -- | -- | -- |
| 09/22/2022 09/22/22 | For Sale | $399,900 | -- | $327 / Sq Ft |
| Year | Tax Paid | Tax Assessment Tax Assessment Total Assessment is a certain percentage of the fair market value that is determined by local assessors to be the total taxable value of land and additions on the property. | Land | Improvement |
|---|---|---|---|---|
| 2025 | $58 | $512,100 | $282,100 | $230,000 |
| 2024 | $5,459 | $467,000 | $265,500 | $201,500 |
| 2023 | $5,406 | $443,500 | $240,600 | $202,900 |
| 2022 | $5,147 | $416,800 | $219,900 | $196,900 |
| 2021 | $4,896 | $398,400 | $207,400 | $191,000 |
| 2020 | $4,670 | $369,200 | $191,700 | $177,500 |
| 2019 | $4,601 | $346,700 | $182,600 | $164,100 |
| 2018 | $4,344 | $308,300 | $151,400 | $156,900 |
| 2017 | $4,251 | $300,000 | $151,400 | $148,600 |
| 2016 | $4,120 | $271,800 | $139,000 | $132,800 |
| 2015 | $4,022 | $255,700 | $132,400 | $123,300 |
| 2014 | $3,845 | $238,800 | $120,300 | $118,500 |
Seller's Agent in 2023
Lin Zhu
Coldwell Banker Realty - Lexington
(339) 203-7199
3 in this area
96 Total Sales
Buyer's Agent in 2023
Sara Dawoud
Lamacchia Realty, Inc.
(857) 452-5524
1 in this area
8 Total Sales
Seller's Agent in 2022
Alison Socha
Leading Edge Real Estate
(781) 983-9326
3 in this area
264 Total Sales