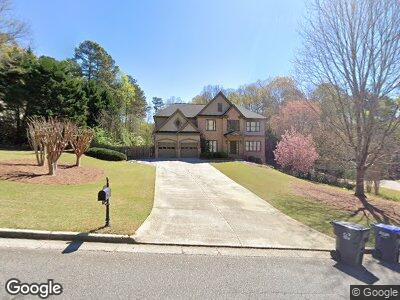
540 Hopewell Downs Dr Alpharetta, GA 30004
Estimated Value: $824,000 - $923,000
4
Beds
4
Baths
3,202
Sq Ft
$269/Sq Ft
Est. Value
About This Home
This home is located at 540 Hopewell Downs Dr, Alpharetta, GA 30004 and is currently estimated at $860,474, approximately $268 per square foot. 540 Hopewell Downs Dr is a home located in Fulton County with nearby schools including Summit Hill Elementary School, Hopewell Middle School, and Cambridge High School.
Ownership History
Date
Name
Owned For
Owner Type
Purchase Details
Closed on
Sep 5, 2002
Sold by
Williams Julie
Bought by
Williams Jack A and Williams Julie
Current Estimated Value
Home Financials for this Owner
Home Financials are based on the most recent Mortgage that was taken out on this home.
Original Mortgage
$30,000
Interest Rate
6.18%
Mortgage Type
Credit Line Revolving
Purchase Details
Closed on
Mar 13, 1998
Sold by
Peachtree Residential Props Inc
Bought by
Williams Jack A and Williams Julie
Home Financials for this Owner
Home Financials are based on the most recent Mortgage that was taken out on this home.
Original Mortgage
$225,900
Interest Rate
6.99%
Mortgage Type
New Conventional
Create a Home Valuation Report for This Property
The Home Valuation Report is an in-depth analysis detailing your home's value as well as a comparison with similar homes in the area
Home Values in the Area
Average Home Value in this Area
Purchase History
| Date | Buyer | Sale Price | Title Company |
|---|---|---|---|
| Williams Jack A | -- | -- | |
| Williams Jack A | $251,000 | -- |
Source: Public Records
Mortgage History
| Date | Status | Borrower | Loan Amount |
|---|---|---|---|
| Open | Williams Jack A | $250,000 | |
| Closed | Williams Jack A | $90,000 | |
| Closed | Williams Jack A | $349,000 | |
| Closed | Williams Jack A | $207,800 | |
| Closed | Williams Jack A | $123,000 | |
| Closed | Williams Jack A | $100,000 | |
| Closed | Williams Jack | $104,000 | |
| Closed | Williams Jack | $30,000 | |
| Previous Owner | Williams Jack A | $30,000 | |
| Previous Owner | Williams Jack A | $225,900 |
Source: Public Records
Tax History Compared to Growth
Tax History
| Year | Tax Paid | Tax Assessment Tax Assessment Total Assessment is a certain percentage of the fair market value that is determined by local assessors to be the total taxable value of land and additions on the property. | Land | Improvement |
|---|---|---|---|---|
| 2023 | $6,490 | $229,920 | $64,520 | $165,400 |
| 2022 | $4,569 | $229,920 | $64,520 | $165,400 |
| 2021 | $4,549 | $194,200 | $61,400 | $132,800 |
| 2020 | $4,589 | $191,920 | $60,680 | $131,240 |
| 2019 | $908 | $188,520 | $59,600 | $128,920 |
| 2018 | $4,530 | $184,080 | $58,200 | $125,880 |
| 2017 | $4,508 | $176,000 | $36,920 | $139,080 |
| 2016 | $4,485 | $176,000 | $36,920 | $139,080 |
| 2015 | $4,065 | $176,000 | $36,920 | $139,080 |
| 2014 | $3,652 | $131,880 | $23,280 | $108,600 |
Source: Public Records