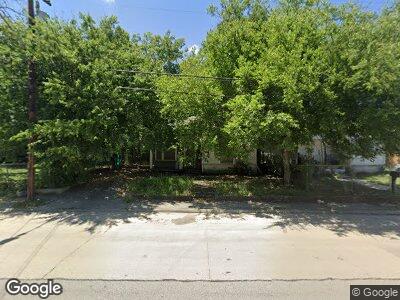
540 Porter St San Antonio, TX 78210
Arena District NeighborhoodEstimated Value: $144,000 - $184,044
2
Beds
1
Bath
937
Sq Ft
$176/Sq Ft
Est. Value
About This Home
This home is located at 540 Porter St, San Antonio, TX 78210 and is currently estimated at $165,011, approximately $176 per square foot. 540 Porter St is a home located in Bexar County with nearby schools including Smith Elementary School, Highlands High School, and Jubilee Highland Park.
Ownership History
Date
Name
Owned For
Owner Type
Purchase Details
Closed on
Sep 3, 2024
Sold by
Alamo House Buyer Solutions Inc
Bought by
Chapawu Properties Llc
Current Estimated Value
Home Financials for this Owner
Home Financials are based on the most recent Mortgage that was taken out on this home.
Original Mortgage
$246,075
Outstanding Balance
$245,440
Interest Rate
6.78%
Mortgage Type
New Conventional
Estimated Equity
-$69,773
Purchase Details
Closed on
Aug 19, 2024
Sold by
Goldline Investments Llc
Bought by
Alamo House Buyer Solutions Inc
Home Financials for this Owner
Home Financials are based on the most recent Mortgage that was taken out on this home.
Original Mortgage
$246,075
Outstanding Balance
$245,440
Interest Rate
6.78%
Mortgage Type
New Conventional
Estimated Equity
-$69,773
Purchase Details
Closed on
Aug 16, 2024
Sold by
Castro David Frederick
Bought by
Goldline Investments Llc
Home Financials for this Owner
Home Financials are based on the most recent Mortgage that was taken out on this home.
Original Mortgage
$246,075
Outstanding Balance
$245,440
Interest Rate
6.78%
Mortgage Type
New Conventional
Estimated Equity
-$69,773
Create a Home Valuation Report for This Property
The Home Valuation Report is an in-depth analysis detailing your home's value as well as a comparison with similar homes in the area
Home Values in the Area
Average Home Value in this Area
Purchase History
| Date | Buyer | Sale Price | Title Company |
|---|---|---|---|
| Chapawu Properties Llc | -- | Alamo Title | |
| Alamo House Buyer Solutions Inc | -- | Spartan Title | |
| Goldline Investments Llc | -- | Spartan Title |
Source: Public Records
Mortgage History
| Date | Status | Borrower | Loan Amount |
|---|---|---|---|
| Open | Chapawu Properties Llc | $246,075 |
Source: Public Records
Tax History Compared to Growth
Tax History
| Year | Tax Paid | Tax Assessment Tax Assessment Total Assessment is a certain percentage of the fair market value that is determined by local assessors to be the total taxable value of land and additions on the property. | Land | Improvement |
|---|---|---|---|---|
| 2023 | $3,014 | $123,520 | $73,340 | $50,180 |
| 2022 | $1,567 | $57,817 | $54,160 | $52,840 |
| 2021 | $1,468 | $52,561 | $38,380 | $44,960 |
| 2020 | $1,354 | $47,783 | $31,810 | $45,230 |
| 2019 | $1,245 | $43,439 | $22,200 | $40,850 |
| 2018 | $1,121 | $39,490 | $7,750 | $37,220 |
| 2017 | $1,013 | $35,900 | $7,070 | $28,830 |
| 2016 | $930 | $32,948 | $7,310 | $26,040 |
| 2015 | $87 | $29,953 | $7,310 | $23,250 |
| 2014 | $87 | $27,230 | $0 | $0 |
Source: Public Records
Map
Nearby Homes
- 305 Porter St
- 933 Denver Blvd
- 1426 S New Braunfels Ave
- 238 Cooper St
- 306 Cooper St
- 1210 S New Braunfels Ave
- 614 Delmar St
- 837 Westfall Ave
- 616 Delmar St
- LOT 34-35 Westfall Ave
- 543 Westfall Ave
- 935 Aransas Ave
- 1123 Essex St
- 1110 S Gevers St
- 1106 S Gevers St
- 1135 Essex St
- 214 Preston Ave
- 1104 S Gevers St
- 204 Vine St
- 1102 S Gevers St