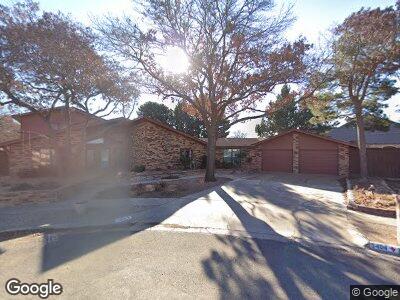
5404 17th Place Lubbock, TX 79416
Estimated Value: $312,000 - $430,000
3
Beds
3
Baths
3,284
Sq Ft
$121/Sq Ft
Est. Value
About This Home
This home is located at 5404 17th Place, Lubbock, TX 79416 and is currently estimated at $396,612, approximately $120 per square foot. 5404 17th Place is a home located in Lubbock County with nearby schools including Hardwick Elementary School, Mackenzie Middle School, and Coronado High School.
Ownership History
Date
Name
Owned For
Owner Type
Purchase Details
Closed on
Oct 15, 2019
Sold by
Clopton James Roy and Clopton Nancy A
Bought by
Brown Milton Drew and Brown Kimberly Dawn
Current Estimated Value
Home Financials for this Owner
Home Financials are based on the most recent Mortgage that was taken out on this home.
Original Mortgage
$243,000
Interest Rate
3.4%
Mortgage Type
New Conventional
Purchase Details
Closed on
Mar 25, 1997
Sold by
Knox Billy G and Knox Peggy L
Bought by
Clopton James and Clopton Nancy
Create a Home Valuation Report for This Property
The Home Valuation Report is an in-depth analysis detailing your home's value as well as a comparison with similar homes in the area
Home Values in the Area
Average Home Value in this Area
Purchase History
| Date | Buyer | Sale Price | Title Company |
|---|---|---|---|
| Brown Milton Drew | -- | None Available | |
| Clopton James | -- | -- |
Source: Public Records
Mortgage History
| Date | Status | Borrower | Loan Amount |
|---|---|---|---|
| Open | Brown Milton Drew | $70,000 | |
| Open | Brown Milton Drew | $258,700 | |
| Closed | Brown Milton Drew | $243,000 | |
| Previous Owner | Clopton James Roy | $75,000 |
Source: Public Records
Tax History Compared to Growth
Tax History
| Year | Tax Paid | Tax Assessment Tax Assessment Total Assessment is a certain percentage of the fair market value that is determined by local assessors to be the total taxable value of land and additions on the property. | Land | Improvement |
|---|---|---|---|---|
| 2024 | $6,718 | $423,766 | $30,190 | $393,576 |
| 2023 | $5,328 | $336,305 | $30,190 | $306,115 |
| 2022 | $6,339 | $313,154 | $30,190 | $282,964 |
| 2021 | $6,544 | $305,543 | $30,190 | $275,353 |
| 2020 | $6,303 | $289,873 | $30,190 | $259,683 |
| 2019 | $5,955 | $265,248 | $30,190 | $235,058 |
| 2018 | $5,962 | $265,248 | $30,190 | $235,058 |
| 2017 | $5,970 | $265,248 | $30,190 | $235,058 |
| 2016 | $5,783 | $256,929 | $30,190 | $226,739 |
| 2015 | $4,560 | $233,572 | $25,158 | $208,414 |
| 2014 | $4,560 | $213,403 | $25,158 | $188,245 |
Source: Public Records
Map
Nearby Homes