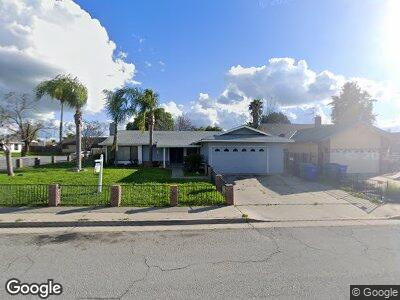
541 Harrison Cir Porterville, CA 93257
Porterville Northeast NeighborhoodEstimated Value: $344,000 - $367,000
3
Beds
2
Baths
1,439
Sq Ft
$245/Sq Ft
Est. Value
About This Home
This home is located at 541 Harrison Cir, Porterville, CA 93257 and is currently estimated at $352,673, approximately $245 per square foot. 541 Harrison Cir is a home located in Tulare County with nearby schools including Roche Avenue Elementary School, Bartlett Middle School, and Granite Hills High School.
Ownership History
Date
Name
Owned For
Owner Type
Purchase Details
Closed on
Jul 17, 2024
Sold by
Espinoza Graciela and Juarez Graciela
Bought by
Espinoza Graciela and Espinoza George
Current Estimated Value
Purchase Details
Closed on
Apr 18, 2019
Sold by
Juarez Marcos R and Juarez Ofelia A
Bought by
Juarez Graciela
Purchase Details
Closed on
Mar 22, 2006
Sold by
Juarez Macario R
Bought by
Juarez Marcos R and Juarez Ofelia A
Home Financials for this Owner
Home Financials are based on the most recent Mortgage that was taken out on this home.
Original Mortgage
$30,000
Interest Rate
6.15%
Mortgage Type
Credit Line Revolving
Purchase Details
Closed on
Sep 22, 1999
Sold by
Weber Amy M
Bought by
Lucio Arnoldo B and Juarez Macario R
Home Financials for this Owner
Home Financials are based on the most recent Mortgage that was taken out on this home.
Original Mortgage
$78,878
Interest Rate
7.95%
Mortgage Type
FHA
Create a Home Valuation Report for This Property
The Home Valuation Report is an in-depth analysis detailing your home's value as well as a comparison with similar homes in the area
Home Values in the Area
Average Home Value in this Area
Purchase History
| Date | Buyer | Sale Price | Title Company |
|---|---|---|---|
| Espinoza Graciela | -- | None Listed On Document | |
| Juarez Graciela | -- | None Available | |
| Juarez Marcos R | -- | None Available | |
| Lucio Arnoldo B | $79,000 | Fidelity National Title Co |
Source: Public Records
Mortgage History
| Date | Status | Borrower | Loan Amount |
|---|---|---|---|
| Previous Owner | Lucio Arnoldo B | $30,000 | |
| Previous Owner | Lucio Arnold B | $86,000 | |
| Previous Owner | Lucio Arnoldo B | $78,878 |
Source: Public Records
Tax History Compared to Growth
Tax History
| Year | Tax Paid | Tax Assessment Tax Assessment Total Assessment is a certain percentage of the fair market value that is determined by local assessors to be the total taxable value of land and additions on the property. | Land | Improvement |
|---|---|---|---|---|
| 2024 | $1,290 | $119,046 | $33,152 | $85,894 |
| 2023 | $1,289 | $116,712 | $32,502 | $84,210 |
| 2022 | $1,249 | $114,424 | $31,865 | $82,559 |
| 2021 | $1,234 | $112,180 | $31,240 | $80,940 |
| 2020 | $1,221 | $111,030 | $30,920 | $80,110 |
| 2019 | $1,199 | $108,853 | $30,314 | $78,539 |
| 2018 | $1,178 | $106,719 | $29,720 | $76,999 |
| 2017 | $1,149 | $104,626 | $29,137 | $75,489 |
| 2016 | $1,102 | $102,575 | $28,566 | $74,009 |
| 2015 | $1,086 | $101,034 | $28,137 | $72,897 |
| 2014 | $1,060 | $99,055 | $27,586 | $71,469 |
Source: Public Records
Map
Nearby Homes
- 534 E Morton Ave
- 465 N Murry St
- 369 E Mill Ave
- 349 E Mill Ave
- 18 S Corona Dr
- 20 S Corona Dr
- 0 S Corona Dr Unit#19
- 0 N Plano St
- 888 Forrester Ct
- 431 N 3rd St
- 988 E Putnam Ave
- 870 E Willow Ave
- 271 N Ruth St
- 609 N 3rd St
- 68 N Martin St
- 896 N Plano St
- 0 S Williams Dr
- 363 Eastridge Cir
- 361 Olivewood Cir
- 207 Carrillo Place