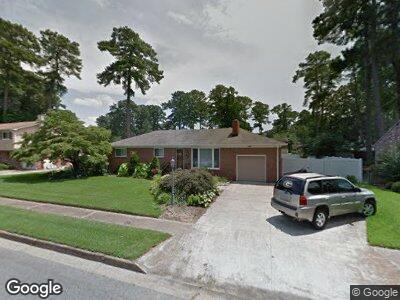
5411 Welaka Rd Norfolk, VA 23502
Wayside Manor NeighborhoodEstimated Value: $326,000 - $367,000
3
Beds
2
Baths
1,450
Sq Ft
$237/Sq Ft
Est. Value
About This Home
This home is located at 5411 Welaka Rd, Norfolk, VA 23502 and is currently estimated at $343,658, approximately $237 per square foot. 5411 Welaka Rd is a home located in Norfolk City with nearby schools including Fairlawn Elementary School, Lake Taylor Middle School, and B.T. Washington High School.
Ownership History
Date
Name
Owned For
Owner Type
Purchase Details
Closed on
Mar 2, 2022
Sold by
Lindsay Kincaid
Bought by
Kuethe Robert C
Current Estimated Value
Home Financials for this Owner
Home Financials are based on the most recent Mortgage that was taken out on this home.
Original Mortgage
$275,975
Outstanding Balance
$260,477
Interest Rate
3.69%
Mortgage Type
New Conventional
Estimated Equity
$85,282
Purchase Details
Closed on
Mar 10, 2021
Sold by
Brown Nicholas and Brown Kelly
Bought by
Kincaid Lindsay
Home Financials for this Owner
Home Financials are based on the most recent Mortgage that was taken out on this home.
Original Mortgage
$175,000
Interest Rate
2.7%
Mortgage Type
New Conventional
Purchase Details
Closed on
May 11, 2020
Sold by
Wood Joshua and Wood Lara
Bought by
Brown Nicholas and Brown Kelly
Home Financials for this Owner
Home Financials are based on the most recent Mortgage that was taken out on this home.
Original Mortgage
$235,000
Interest Rate
3.3%
Mortgage Type
VA
Create a Home Valuation Report for This Property
The Home Valuation Report is an in-depth analysis detailing your home's value as well as a comparison with similar homes in the area
Home Values in the Area
Average Home Value in this Area
Purchase History
| Date | Buyer | Sale Price | Title Company |
|---|---|---|---|
| Kuethe Robert C | $305,000 | Fidelity National Title | |
| Kincaid Lindsay | $275,000 | Priority Title And Escrow | |
| Brown Nicholas | $235,000 | Title Concepts Llc |
Source: Public Records
Mortgage History
| Date | Status | Borrower | Loan Amount |
|---|---|---|---|
| Open | Kuethe Robert C | $275,975 | |
| Previous Owner | Kincaid Lindsay | $175,000 | |
| Previous Owner | Brown Nicholas | $235,000 | |
| Previous Owner | Wood Joshua B | $236,345 | |
| Previous Owner | Calcagni Paul C | $189,750 |
Source: Public Records
Tax History Compared to Growth
Tax History
| Year | Tax Paid | Tax Assessment Tax Assessment Total Assessment is a certain percentage of the fair market value that is determined by local assessors to be the total taxable value of land and additions on the property. | Land | Improvement |
|---|---|---|---|---|
| 2024 | $3,844 | $307,500 | $73,100 | $234,400 |
| 2023 | $3,738 | $299,000 | $73,100 | $225,900 |
| 2022 | $3,519 | $281,500 | $65,700 | $215,800 |
| 2021 | $3,234 | $255,800 | $54,700 | $201,100 |
| 2020 | $3,026 | $242,100 | $50,100 | $192,000 |
| 2019 | $3,026 | $242,100 | $50,100 | $192,000 |
| 2018 | $2,775 | $222,000 | $45,500 | $176,500 |
| 2017 | $2,529 | $219,900 | $45,500 | $174,400 |
| 2016 | $2,529 | $189,000 | $45,500 | $143,500 |
| 2015 | $1,617 | $189,000 | $45,500 | $143,500 |
| 2014 | $1,617 | $189,000 | $45,500 | $143,500 |
Source: Public Records
Map
Nearby Homes
- 148 Kimberly Ln
- 432 Leepoint Rd
- 417 Beacon Hill Cir
- 493 Beacon Hill Cir
- 3767 Brennan Ave
- 849 E Sparrow Rd
- 5801 Lathan Rd
- 5330 Barharbor Dr
- 5813 Bartee St
- 823 Jasmine Ave
- 3509 Byrn Brae Dr
- 818 Oak Ave
- 5920 Mcclure Rd
- 809 Pinecrest Rd
- 5902 Appleton Dr
- 748 Red Mill Rd
- 5900 Adderley St
- 6313 Jonathans Cove Dr
- 3639 Wedgefield Ave
- 168 Honaker Ave