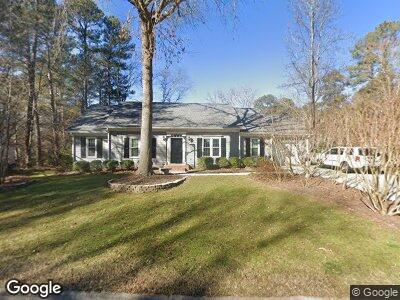
5418 Fortunes Ridge Dr Durham, NC 27713
Woodcroft NeighborhoodEstimated Value: $437,441 - $478,000
3
Beds
2
Baths
1,683
Sq Ft
$271/Sq Ft
Est. Value
About This Home
This home is located at 5418 Fortunes Ridge Dr, Durham, NC 27713 and is currently estimated at $456,610, approximately $271 per square foot. 5418 Fortunes Ridge Dr is a home located in Durham County with nearby schools including Southwest Elementary School, Morehead Montessori, and Sherwood Githens Middle.
Ownership History
Date
Name
Owned For
Owner Type
Purchase Details
Closed on
May 16, 2012
Sold by
Naomi Timothy B
Bought by
Lamkin Seth Hunter and Corra Ashley Julia
Current Estimated Value
Home Financials for this Owner
Home Financials are based on the most recent Mortgage that was taken out on this home.
Original Mortgage
$172,800
Outstanding Balance
$123,681
Interest Rate
4.01%
Mortgage Type
New Conventional
Estimated Equity
$324,754
Purchase Details
Closed on
Jun 9, 2008
Sold by
Ripley Andrew Louis
Bought by
Naomi Timothy
Home Financials for this Owner
Home Financials are based on the most recent Mortgage that was taken out on this home.
Original Mortgage
$210,833
Interest Rate
6.04%
Mortgage Type
FHA
Create a Home Valuation Report for This Property
The Home Valuation Report is an in-depth analysis detailing your home's value as well as a comparison with similar homes in the area
Home Values in the Area
Average Home Value in this Area
Purchase History
| Date | Buyer | Sale Price | Title Company |
|---|---|---|---|
| Lamkin Seth Hunter | $219,000 | None Available | |
| Naomi Timothy | $212,500 | None Available |
Source: Public Records
Mortgage History
| Date | Status | Borrower | Loan Amount |
|---|---|---|---|
| Open | Lamkin Seth Hunter | $172,800 | |
| Previous Owner | Naomi Timothy | $210,833 | |
| Previous Owner | Ripley Andrew L | $146,700 | |
| Previous Owner | Ripley Andrew Louis | $45,500 | |
| Previous Owner | Ripley Andrew | $38,900 | |
| Previous Owner | Ripley Andrew | $139,700 |
Source: Public Records
Tax History Compared to Growth
Tax History
| Year | Tax Paid | Tax Assessment Tax Assessment Total Assessment is a certain percentage of the fair market value that is determined by local assessors to be the total taxable value of land and additions on the property. | Land | Improvement |
|---|---|---|---|---|
| 2024 | $3,272 | $234,601 | $54,675 | $179,926 |
| 2023 | $3,073 | $234,601 | $54,675 | $179,926 |
| 2022 | $3,003 | $234,601 | $54,675 | $179,926 |
| 2021 | $2,989 | $234,601 | $54,675 | $179,926 |
| 2020 | $2,918 | $234,601 | $54,675 | $179,926 |
| 2019 | $2,918 | $234,601 | $54,675 | $179,926 |
| 2018 | $3,054 | $225,134 | $36,450 | $188,684 |
| 2017 | $3,031 | $225,134 | $36,450 | $188,684 |
| 2016 | $2,929 | $225,134 | $36,450 | $188,684 |
| 2015 | $2,797 | $202,055 | $36,533 | $165,522 |
| 2014 | -- | $202,055 | $36,533 | $165,522 |
Source: Public Records
Map
Nearby Homes
- 4815 Fortunes Ridge Dr
- 5340 Fayetteville Rd
- 323 Brandermill Dr
- 200 W Woodcroft Pkwy Unit 45c
- 200 W Woodcroft Pkwy Unit 37a
- 5500 Fortunes Ridge Dr Unit 82B
- 5500 Fortunes Ridge Dr Unit 72A
- 116 Lakeshore Dr
- 111 Nuttree Way
- 101 Lakeshore Dr
- 520 Tall Oaks Dr
- 12 Citation Dr
- 6 Preakness Dr
- 7 Wythebrook Ln
- 500 W Woodcroft Pkwy Unit 17c
- 500 W Woodcroft Pkwy Unit 13d
- 500 W Woodcroft Pkwy
- 500 W Woodcroft Pkwy Unit 16d
- 500 W Woodcroft Pkwy Unit 8c
- 4 Applewood Square