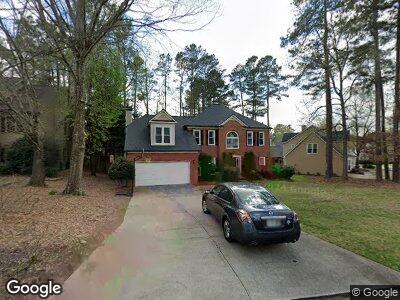
5425 Hillgate Crossing Alpharetta, GA 30005
Ocee NeighborhoodEstimated Value: $618,000 - $634,000
4
Beds
3
Baths
2,198
Sq Ft
$284/Sq Ft
Est. Value
About This Home
This home is located at 5425 Hillgate Crossing, Alpharetta, GA 30005 and is currently estimated at $624,456, approximately $284 per square foot. 5425 Hillgate Crossing is a home located in Fulton County with nearby schools including Abbotts Hill Elementary School, Taylor Road Middle School, and Chattahoochee High School.
Ownership History
Date
Name
Owned For
Owner Type
Purchase Details
Closed on
May 4, 2023
Sold by
Abarca Luis A
Bought by
Abarca Luis A and Abarca Irina
Current Estimated Value
Purchase Details
Closed on
Jul 21, 2008
Sold by
Sullivan Michael and Sullivan Dianne
Bought by
Abarca Luis A
Home Financials for this Owner
Home Financials are based on the most recent Mortgage that was taken out on this home.
Original Mortgage
$228,000
Interest Rate
6.27%
Mortgage Type
New Conventional
Purchase Details
Closed on
May 28, 1993
Sold by
Ciullo Robert E Emily N
Bought by
Merkel Frederick R
Home Financials for this Owner
Home Financials are based on the most recent Mortgage that was taken out on this home.
Original Mortgage
$150,300
Interest Rate
7.5%
Mortgage Type
VA
Create a Home Valuation Report for This Property
The Home Valuation Report is an in-depth analysis detailing your home's value as well as a comparison with similar homes in the area
Home Values in the Area
Average Home Value in this Area
Purchase History
| Date | Buyer | Sale Price | Title Company |
|---|---|---|---|
| Abarca Luis A | -- | -- | |
| Abarca Luis A | $285,000 | -- | |
| Merkel Frederick R | $167,000 | -- |
Source: Public Records
Mortgage History
| Date | Status | Borrower | Loan Amount |
|---|---|---|---|
| Previous Owner | Abarca Luis A | $187,800 | |
| Previous Owner | Abarca Luis A | $226,000 | |
| Previous Owner | Abarca Luis A | $228,000 | |
| Previous Owner | Sullivan Michael | $10,000 | |
| Previous Owner | Hoffman Stephen | $45,000 | |
| Previous Owner | Hoffman Stephen | $160,000 | |
| Previous Owner | Merkel Frederick R | $150,300 |
Source: Public Records
Tax History Compared to Growth
Tax History
| Year | Tax Paid | Tax Assessment Tax Assessment Total Assessment is a certain percentage of the fair market value that is determined by local assessors to be the total taxable value of land and additions on the property. | Land | Improvement |
|---|---|---|---|---|
| 2023 | $5,522 | $195,640 | $46,000 | $149,640 |
| 2022 | $3,302 | $165,960 | $42,480 | $123,480 |
| 2021 | $3,256 | $128,640 | $37,040 | $91,600 |
| 2020 | $3,274 | $120,880 | $30,200 | $90,680 |
| 2019 | $389 | $118,760 | $29,680 | $89,080 |
| 2018 | $3,313 | $115,960 | $28,960 | $87,000 |
| 2017 | $3,221 | $106,800 | $30,760 | $76,040 |
| 2016 | $3,353 | $115,200 | $30,760 | $84,440 |
| 2015 | $3,144 | $105,120 | $30,760 | $74,360 |
| 2014 | $2,536 | $84,960 | $24,840 | $60,120 |
Source: Public Records
Map
Nearby Homes
- 230 Bristolstone Ct Unit 5
- 11894 Aspen Forest Dr
- 280 Leaf Ct
- 11770 Ashwick Place Unit 1
- 11570 Dunhill Place Dr
- 12350 Broadleaf Ln
- 11365 Donnington Dr
- 5198 Wellsley Bend
- 400 Overhill Bend
- 5260 Cresslyn Ridge
- 11780 Wellsley Way
- 115 Westbury Ln
- 940 Magnolia Blossom Ct Unit 4D
- 5755 Haterleigh Dr Unit 1
- 140 Boxford Ct
- 935 Magnolia Blossom Ct
- 11895 Leeward Walk Cir