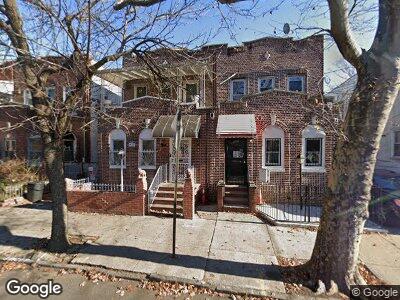
543 Miller Ave Brooklyn, NY 11207
East New York NeighborhoodEstimated Value: $903,090 - $923,000
--
Bed
--
Bath
1,620
Sq Ft
$566/Sq Ft
Est. Value
About This Home
This home is located at 543 Miller Ave, Brooklyn, NY 11207 and is currently estimated at $916,773, approximately $565 per square foot. 543 Miller Ave is a home located in Kings County with nearby schools including P.S. 149 Danny Kaye, J.H.S 292 Margaret S. Douglas, and Achievement First - East New York School.
Ownership History
Date
Name
Owned For
Owner Type
Purchase Details
Closed on
Oct 6, 2016
Sold by
1895A Pacific Llc
Bought by
Olabisi David
Current Estimated Value
Purchase Details
Closed on
Dec 4, 2013
Sold by
Olabisi David
Bought by
1895A Pacific Llc
Purchase Details
Closed on
Dec 20, 2006
Sold by
Pinkard Robert
Bought by
Olabisi David
Home Financials for this Owner
Home Financials are based on the most recent Mortgage that was taken out on this home.
Original Mortgage
$488,000
Interest Rate
6.24%
Mortgage Type
Purchase Money Mortgage
Purchase Details
Closed on
Feb 15, 2000
Sold by
Stclair Stephen and Stclair Viola
Bought by
Pinkard Robert
Home Financials for this Owner
Home Financials are based on the most recent Mortgage that was taken out on this home.
Original Mortgage
$62,500
Interest Rate
8.3%
Mortgage Type
Purchase Money Mortgage
Create a Home Valuation Report for This Property
The Home Valuation Report is an in-depth analysis detailing your home's value as well as a comparison with similar homes in the area
Home Values in the Area
Average Home Value in this Area
Purchase History
| Date | Buyer | Sale Price | Title Company |
|---|---|---|---|
| Olabisi David | -- | -- | |
| 1895A Pacific Llc | $20,000 | -- | |
| 1895A Pacific Llc | $20,000 | -- | |
| Olabisi David | $610,000 | -- | |
| Olabisi David | $610,000 | -- | |
| Pinkard Robert | $162,500 | Lawyers Title Insurance Corp | |
| Pinkard Robert | $162,500 | Lawyers Title Insurance Corp |
Source: Public Records
Mortgage History
| Date | Status | Borrower | Loan Amount |
|---|---|---|---|
| Previous Owner | Olabisi David | $488,000 | |
| Previous Owner | Olabisi David | $122,000 | |
| Previous Owner | Pinkard Robert | $62,500 | |
| Previous Owner | Stclair Viola | $132,000 |
Source: Public Records
Tax History Compared to Growth
Tax History
| Year | Tax Paid | Tax Assessment Tax Assessment Total Assessment is a certain percentage of the fair market value that is determined by local assessors to be the total taxable value of land and additions on the property. | Land | Improvement |
|---|---|---|---|---|
| 2024 | $4,482 | $41,340 | $15,840 | $25,500 |
| 2023 | $4,532 | $43,920 | $15,840 | $28,080 |
| 2022 | $4,421 | $36,960 | $15,840 | $21,120 |
| 2021 | $4,397 | $40,560 | $15,840 | $24,720 |
| 2020 | $2,062 | $36,720 | $15,840 | $20,880 |
| 2019 | $3,890 | $36,720 | $15,840 | $20,880 |
| 2018 | $3,790 | $18,594 | $7,879 | $10,715 |
| 2017 | $3,762 | $18,453 | $8,399 | $10,054 |
| 2016 | $3,480 | $17,409 | $8,941 | $8,468 |
| 2015 | $2,100 | $16,424 | $6,581 | $9,843 |
| 2014 | $2,100 | $15,495 | $6,530 | $8,965 |
Source: Public Records
Map
Nearby Homes
- 816 Dumont Ave
- 598 Miller Ave
- 502 Schenck Ave
- 470 Wyona St
- 412 Bradford St
- 760 Livonia Ave
- 637 Hendrix St
- 582 van Siclen Ave Unit 2
- 440 Miller Ave
- 443 Miller Ave
- 587 van Siclen Ave
- 591 van Siclen Ave
- 380 Bradford St
- 680 Hendrix St
- 385 van Siclen Ave
- 659 Miller Ave
- 874 Blake Ave
- 570 Jerome St
- 572 Jerome St
- 414 Miller Ave