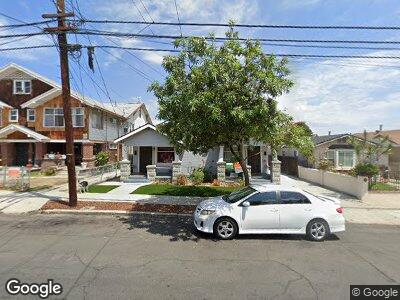
544 W 12th St San Pedro, CA 90731
San Pedro NeighborhoodEstimated Value: $702,000 - $1,004,000
5
Beds
3
Baths
2,726
Sq Ft
$314/Sq Ft
Est. Value
About This Home
This home is located at 544 W 12th St, San Pedro, CA 90731 and is currently estimated at $855,185, approximately $313 per square foot. 544 W 12th St is a home located in Los Angeles County with nearby schools including Fifteenth Street Elementary School, Dana Middle School, and San Pedro Senior High School.
Ownership History
Date
Name
Owned For
Owner Type
Purchase Details
Closed on
Mar 28, 2001
Sold by
Ponce Jesus
Bought by
Rivas Javier and Rivas Graciela
Current Estimated Value
Home Financials for this Owner
Home Financials are based on the most recent Mortgage that was taken out on this home.
Original Mortgage
$215,000
Interest Rate
7.21%
Purchase Details
Closed on
Aug 5, 1994
Sold by
Zanze Nick A and Zanze Beverly June
Bought by
Rivas Javier and Rivas Graciela
Home Financials for this Owner
Home Financials are based on the most recent Mortgage that was taken out on this home.
Original Mortgage
$176,227
Interest Rate
8.57%
Mortgage Type
FHA
Purchase Details
Closed on
Apr 14, 1994
Sold by
Kraljev Sylvia C
Bought by
Sylvia Kraljev Revocable Trust
Create a Home Valuation Report for This Property
The Home Valuation Report is an in-depth analysis detailing your home's value as well as a comparison with similar homes in the area
Home Values in the Area
Average Home Value in this Area
Purchase History
| Date | Buyer | Sale Price | Title Company |
|---|---|---|---|
| Rivas Javier | -- | First American Title Co | |
| Rivas Javier | $181,000 | First American Title Company | |
| Sylvia Kraljev Revocable Trust | -- | First American Title |
Source: Public Records
Mortgage History
| Date | Status | Borrower | Loan Amount |
|---|---|---|---|
| Open | Rivas Javier | $320,000 | |
| Closed | Lamas Javier R | $100,000 | |
| Closed | Lamas Javier Rivas | $215,500 | |
| Previous Owner | Rivas Javier | $215,000 | |
| Previous Owner | Rivas Javier | $25,000 | |
| Previous Owner | Rivas Javier | $176,227 |
Source: Public Records
Tax History Compared to Growth
Tax History
| Year | Tax Paid | Tax Assessment Tax Assessment Total Assessment is a certain percentage of the fair market value that is determined by local assessors to be the total taxable value of land and additions on the property. | Land | Improvement |
|---|---|---|---|---|
| 2024 | $4,249 | $314,533 | $201,725 | $112,808 |
| 2023 | $4,174 | $308,367 | $197,770 | $110,597 |
| 2022 | $3,992 | $302,322 | $193,893 | $108,429 |
| 2021 | $3,931 | $296,395 | $190,092 | $106,303 |
| 2020 | $3,964 | $293,356 | $188,143 | $105,213 |
| 2019 | $3,821 | $287,604 | $184,454 | $103,150 |
| 2018 | $3,676 | $281,966 | $180,838 | $101,128 |
| 2017 | $3,598 | $276,439 | $177,293 | $99,146 |
| 2016 | $3,489 | $271,019 | $173,817 | $97,202 |
| 2015 | $3,441 | $266,949 | $171,207 | $95,742 |
| 2014 | $3,434 | $261,721 | $167,854 | $93,867 |
Source: Public Records
Map
Nearby Homes
- 561 W 12th St
- 523 W 12th St
- 564 W 13th St Unit F
- 576 W 13th St
- 1311 S Grand Ave Unit 5
- 675 W 11th St
- 1309 S Mesa St
- 1224 S Mesa St
- 362 W 11th St
- 670 W 15th St
- 1412 S Mesa St
- 343 W 12th St
- 460 W 8th St
- 792 W 12th St
- 338 W 9th St
- 720 W 16th St
- 1052 W 6th St
- 827 W 10th St
- 523 S Grand Ave
- 295 Dockside Ln