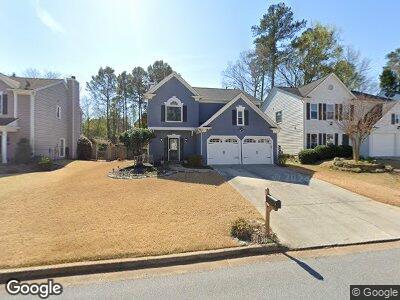
545 Rosedown Way Alpharetta, GA 30022
Newtown NeighborhoodEstimated Value: $536,000 - $587,000
3
Beds
3
Baths
2,012
Sq Ft
$279/Sq Ft
Est. Value
About This Home
This home is located at 545 Rosedown Way, Alpharetta, GA 30022 and is currently estimated at $562,107, approximately $279 per square foot. 545 Rosedown Way is a home located in Fulton County with nearby schools including Barnwell Elementary School, Autrey Mill Middle School, and Johns Creek High School.
Ownership History
Date
Name
Owned For
Owner Type
Purchase Details
Closed on
Feb 16, 2024
Sold by
Yarnall Nicole K
Bought by
Yarnall Family Revocable Trust and Yarnall Nicole K Tr
Current Estimated Value
Purchase Details
Closed on
Feb 11, 2005
Sold by
Herrbach R W R and Herrbach Jennifer
Bought by
Yarnall Nicole K
Home Financials for this Owner
Home Financials are based on the most recent Mortgage that was taken out on this home.
Original Mortgage
$170,400
Interest Rate
5.69%
Mortgage Type
New Conventional
Purchase Details
Closed on
Jul 29, 1994
Sold by
Telenko Duna S
Bought by
Ryan Thomas J Elizabeth
Home Financials for this Owner
Home Financials are based on the most recent Mortgage that was taken out on this home.
Original Mortgage
$123,200
Interest Rate
8.39%
Create a Home Valuation Report for This Property
The Home Valuation Report is an in-depth analysis detailing your home's value as well as a comparison with similar homes in the area
Home Values in the Area
Average Home Value in this Area
Purchase History
| Date | Buyer | Sale Price | Title Company |
|---|---|---|---|
| Yarnall Family Revocable Trust | -- | -- | |
| Yarnall Nicole K | $213,000 | -- | |
| Ryan Thomas J Elizabeth | $136,900 | -- |
Source: Public Records
Mortgage History
| Date | Status | Borrower | Loan Amount |
|---|---|---|---|
| Previous Owner | Yarnall Nicole K | $166,000 | |
| Previous Owner | Yarnall Nicole K | $170,400 | |
| Previous Owner | Herrbach R W | $163,337 | |
| Previous Owner | Herrbach R Wynne | $35,000 | |
| Previous Owner | Ryan Thomas J Elizabeth | $123,200 |
Source: Public Records
Tax History Compared to Growth
Tax History
| Year | Tax Paid | Tax Assessment Tax Assessment Total Assessment is a certain percentage of the fair market value that is determined by local assessors to be the total taxable value of land and additions on the property. | Land | Improvement |
|---|---|---|---|---|
| 2023 | $5,524 | $195,720 | $42,360 | $153,360 |
| 2022 | $2,726 | $154,240 | $31,520 | $122,720 |
| 2021 | $2,687 | $125,960 | $28,440 | $97,520 |
| 2020 | $2,701 | $120,400 | $25,640 | $94,760 |
| 2019 | $326 | $121,560 | $24,680 | $96,880 |
| 2018 | $2,959 | $107,880 | $24,160 | $83,720 |
| 2017 | $2,633 | $89,520 | $19,920 | $69,600 |
| 2016 | $2,631 | $90,880 | $19,920 | $70,960 |
| 2015 | $2,651 | $90,600 | $19,920 | $70,680 |
| 2014 | $2,316 | $78,720 | $12,760 | $65,960 |
Source: Public Records
Map
Nearby Homes
- 1050 Westwell Run
- 9030 Brockham Way Unit 1
- 3465 Jones Ferry Ln
- 335 Wyehwood Ct
- 3597 Old Maple Rd
- 10015 Timberstone Rd
- 645 Crossbridge Alley
- 3585 Legacy Trace
- 3335 New Heritage Dr
- 10090 Jones Bridge Rd Unit 2
- 110 Randomwood Way
- 300 Olmstead Way
- 10245 Old Woodland Entry
- 211 Meritage Dr
- 10350 Alvin Rd
- 10215 Alvin Rd
- 370 Landing Entry