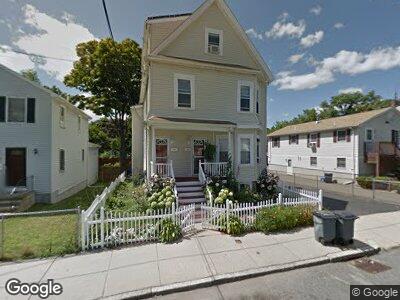
55 Mount Hope St Roslindale, MA 02131
Roslindale NeighborhoodEstimated Value: $964,000 - $1,183,000
6
Beds
4
Baths
2,707
Sq Ft
$415/Sq Ft
Est. Value
About This Home
This home is located at 55 Mount Hope St, Roslindale, MA 02131 and is currently estimated at $1,123,999, approximately $415 per square foot. 55 Mount Hope St is a home located in Suffolk County with nearby schools including Brooke Charter School Roslindale, Sacred Heart STEM School, and St. Clare High School.
Ownership History
Date
Name
Owned For
Owner Type
Purchase Details
Closed on
Jun 26, 2008
Sold by
Wells Fargo Bk
Bought by
Menzie-Brown Joan
Current Estimated Value
Purchase Details
Closed on
May 31, 2007
Sold by
Romero Carlos and Wells Fargo Bk Na
Bought by
Wells Fargo Bk
Purchase Details
Closed on
May 9, 2005
Sold by
Sanzi Roseanne V
Bought by
Romero Carlos and Romero Mayra
Purchase Details
Closed on
Jul 29, 1994
Sold by
Musto Angelo
Bought by
Sanzi Roseanne V
Purchase Details
Closed on
Aug 23, 1993
Sold by
Finnell Francis A and Finnell Irene K
Bought by
Musto Angelo
Create a Home Valuation Report for This Property
The Home Valuation Report is an in-depth analysis detailing your home's value as well as a comparison with similar homes in the area
Home Values in the Area
Average Home Value in this Area
Purchase History
| Date | Buyer | Sale Price | Title Company |
|---|---|---|---|
| Menzie-Brown Joan | $339,900 | -- | |
| Menzie-Brown Joan | $339,900 | -- | |
| Wells Fargo Bk | $350,000 | -- | |
| Wells Fargo Bk | $350,000 | -- | |
| Romero Carlos | $560,000 | -- | |
| Romero Carlos | $560,000 | -- | |
| Sanzi Roseanne V | $140,000 | -- | |
| Sanzi Roseanne V | $140,000 | -- | |
| Musto Angelo | $56,000 | -- | |
| Musto Angelo | $56,000 | -- |
Source: Public Records
Mortgage History
| Date | Status | Borrower | Loan Amount |
|---|---|---|---|
| Open | Dorange Magalie | $1,114,442 | |
| Closed | Dorange Magalie | $1,114,442 | |
| Closed | Menzie-Brown Joan | $260,900 | |
| Closed | Menzie-Brown Joan | $301,000 | |
| Closed | Musto Angelo | $15,000 |
Source: Public Records
Tax History Compared to Growth
Tax History
| Year | Tax Paid | Tax Assessment Tax Assessment Total Assessment is a certain percentage of the fair market value that is determined by local assessors to be the total taxable value of land and additions on the property. | Land | Improvement |
|---|---|---|---|---|
| 2025 | $11,130 | $961,100 | $241,500 | $719,600 |
| 2024 | $9,911 | $909,300 | $229,100 | $680,200 |
| 2023 | $9,303 | $866,200 | $218,200 | $648,000 |
| 2022 | $8,725 | $801,900 | $202,000 | $599,900 |
| 2021 | $8,072 | $756,500 | $190,600 | $565,900 |
| 2020 | $7,310 | $692,200 | $180,200 | $512,000 |
| 2019 | $7,012 | $665,300 | $146,600 | $518,700 |
| 2018 | $6,456 | $616,000 | $146,600 | $469,400 |
| 2017 | $6,093 | $575,400 | $146,600 | $428,800 |
| 2016 | $6,139 | $558,100 | $142,700 | $415,400 |
| 2015 | $5,143 | $424,700 | $124,300 | $300,400 |
| 2014 | $4,828 | $383,800 | $124,300 | $259,500 |
Source: Public Records
Map
Nearby Homes
- 58 Mount Hope St
- 498 Hyde Park Ave
- 493 Hyde Park Ave Unit 3
- 27 Rowe St
- 8 Mount Calvary Rd Unit 4
- 12 Neponset Ct
- 103 Neponset Ave Unit 105
- 105 Neponset Ave Unit 105
- 237 Cummins Hwy
- 50 Seymour St Unit 12
- 37 Halliday St
- 17 Seymour St Unit 1
- 17 Seymour St Unit 3
- 138 Sycamore St
- 94 Hawthorne St
- 660 Canterbury St
- 126 Florence St
- 579 American Legion Hwy
- 67 Cummins Hwy Unit 302
- 65 Southbourne Rd