Estimated Value: $120,246 - $145,000
2
Beds
1
Bath
808
Sq Ft
$169/Sq Ft
Est. Value
About This Home
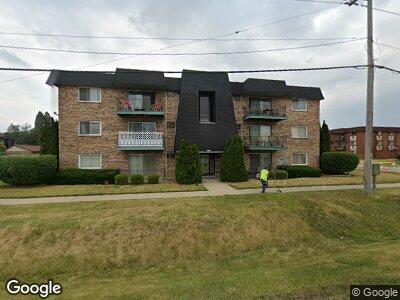
This home is located at 5500 W 127th St Unit 12, Alsip, IL 60803 and is currently estimated at $136,562, approximately $169 per square foot. 5500 W 127th St Unit 12 is a home located in Cook County with nearby schools including Hazelgreen Elementary School, Prairie Jr High School, and A B Shepard High School.
Ownership History
Date
Name
Owned For
Owner Type
Purchase Details
Closed on
Mar 31, 2025
Sold by
Lmcc Property Management Llc
Bought by
Alsip 5500 Llc
Current Estimated Value
Purchase Details
Closed on
Jan 14, 2022
Sold by
Collachia Christopher and Mcelheny Lawrence
Bought by
Lmcc Property Management Llc
Purchase Details
Closed on
Dec 16, 2021
Sold by
Collachia Christopher and Mcelheny Lawrence
Bought by
Lmcc Property Management Llc
Purchase Details
Closed on
Sep 2, 2020
Sold by
Cummins Tresch Kelly M and Tresch Michael T
Bought by
Collachia Christopher L and Mcelheny Lawrence
Purchase Details
Closed on
Dec 28, 2007
Sold by
Tresch Michael K
Bought by
Cummins Kelly M
Home Financials for this Owner
Home Financials are based on the most recent Mortgage that was taken out on this home.
Original Mortgage
$111,900
Interest Rate
7.25%
Mortgage Type
Unknown
Create a Home Valuation Report for This Property
The Home Valuation Report is an in-depth analysis detailing your home's value as well as a comparison with similar homes in the area
Home Values in the Area
Average Home Value in this Area
Purchase History
| Date | Buyer | Sale Price | Title Company |
|---|---|---|---|
| Alsip 5500 Llc | $110,000 | None Listed On Document | |
| Lmcc Property Management Llc | -- | -- | |
| Lmcc Property Management Llc | -- | -- | |
| Lmcc Property Management Llc | -- | -- | |
| Collachia Christopher L | $80,000 | Chicago Title | |
| Cummins Kelly M | $140,000 | Cti |
Source: Public Records
Mortgage History
| Date | Status | Borrower | Loan Amount |
|---|---|---|---|
| Previous Owner | Cummins Tresch Kelly | $61,864 | |
| Previous Owner | Cummins Kelly M | $111,900 |
Source: Public Records
Tax History Compared to Growth
Tax History
| Year | Tax Paid | Tax Assessment Tax Assessment Total Assessment is a certain percentage of the fair market value that is determined by local assessors to be the total taxable value of land and additions on the property. | Land | Improvement |
|---|---|---|---|---|
| 2024 | $2,960 | $8,230 | $1,130 | $7,100 |
| 2023 | $2,960 | $8,230 | $1,130 | $7,100 |
| 2022 | $2,960 | $7,371 | $1,695 | $5,676 |
| 2021 | $2,816 | $7,370 | $1,695 | $5,675 |
| 2020 | $2,783 | $7,370 | $1,695 | $5,675 |
| 2019 | $2,210 | $5,641 | $1,533 | $4,108 |
| 2018 | $2,127 | $5,641 | $1,533 | $4,108 |
| 2017 | $2,143 | $5,641 | $1,533 | $4,108 |
| 2016 | $1,878 | $4,843 | $1,291 | $3,552 |
| 2015 | $1,863 | $4,843 | $1,291 | $3,552 |
| 2014 | $1,904 | $5,128 | $1,291 | $3,837 |
| 2013 | $2,934 | $8,544 | $1,291 | $7,253 |
Source: Public Records
Map
Nearby Homes
- 12620 S Alpine Dr Unit 8
- 5215 Park Place Unit J2
- 12801 Carriage Ln Unit 102
- 5715 129th St Unit 1A
- 9208 S Monitor Ave
- 12900 Crestbrook Ct Unit 3
- 5421 W 130th St
- 5844 W 124th St
- 12840 S Mason Ave
- 13051 S Mason Ave
- 12857 S Austin Ave
- 12607 S Meade Ave
- 12601 S Moody Ave
- 5228 W 121st Place
- 13308 W Circle Drive Pkwy Unit 107
- 12346 S Lamon Ave
- 4840 W Engle Rd Unit 2NE
- 5540 135th St
- 13407 Laramie Ave
- 12323 S Spruce Ct