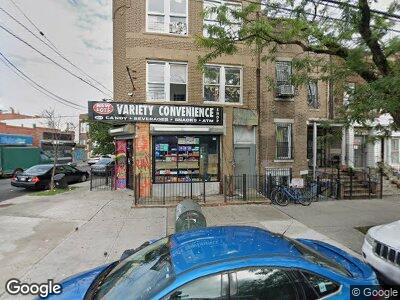
559 New Lots Ave Brooklyn, NY 11207
East New York NeighborhoodEstimated Value: $913,830
6
Beds
2
Baths
2,800
Sq Ft
$326/Sq Ft
Est. Value
About This Home
This home is located at 559 New Lots Ave, Brooklyn, NY 11207 and is currently estimated at $913,830, approximately $326 per square foot. 559 New Lots Ave is a home located in Kings County with nearby schools including P.S. 13 Roberto Clemente, J.H.S 292 Margaret S. Douglas, and Achievement First Linden Charter School.
Ownership History
Date
Name
Owned For
Owner Type
Purchase Details
Closed on
Dec 13, 2023
Sold by
Grant Anthony A
Bought by
559 New Lots Llc
Current Estimated Value
Purchase Details
Closed on
May 11, 2007
Sold by
Thomas Victoria H
Bought by
Grant Anthony A
Home Financials for this Owner
Home Financials are based on the most recent Mortgage that was taken out on this home.
Original Mortgage
$84,000
Interest Rate
6.27%
Mortgage Type
Commercial
Purchase Details
Closed on
Sep 3, 2001
Sold by
Thomas Herley and Nieves Edward
Bought by
Thomas Victoria H
Purchase Details
Closed on
Jul 27, 1998
Sold by
Thomas Herley
Bought by
Thomas Herley and Nieves Edward
Home Financials for this Owner
Home Financials are based on the most recent Mortgage that was taken out on this home.
Original Mortgage
$65,000
Interest Rate
6.74%
Mortgage Type
Commercial
Create a Home Valuation Report for This Property
The Home Valuation Report is an in-depth analysis detailing your home's value as well as a comparison with similar homes in the area
Home Values in the Area
Average Home Value in this Area
Purchase History
| Date | Buyer | Sale Price | Title Company |
|---|---|---|---|
| 559 New Lots Llc | $880,000 | -- | |
| 559 New Lots Llc | $880,000 | -- | |
| Grant Anthony A | $42,000 | -- | |
| Grant Anthony A | $42,000 | -- | |
| Thomas Victoria H | -- | -- | |
| Thomas Victoria H | -- | -- | |
| Thomas Herley | -- | Commonwealth Land Title Ins | |
| Thomas Herley | -- | Commonwealth Land Title Ins |
Source: Public Records
Mortgage History
| Date | Status | Borrower | Loan Amount |
|---|---|---|---|
| Previous Owner | Grant Anthony A | $84,000 | |
| Previous Owner | Grant Anthony A | $294,000 | |
| Previous Owner | Thomas Herley | $65,000 |
Source: Public Records
Tax History Compared to Growth
Tax History
| Year | Tax Paid | Tax Assessment Tax Assessment Total Assessment is a certain percentage of the fair market value that is determined by local assessors to be the total taxable value of land and additions on the property. | Land | Improvement |
|---|---|---|---|---|
| 2024 | $4,543 | $58,560 | $8,100 | $50,460 |
| 2023 | $4,334 | $57,840 | $8,100 | $49,740 |
| 2022 | $4,209 | $56,640 | $8,100 | $48,540 |
| 2021 | $4,325 | $51,000 | $8,100 | $42,900 |
| 2020 | $2,028 | $31,380 | $8,100 | $23,280 |
| 2019 | $3,943 | $31,380 | $8,100 | $23,280 |
| 2018 | $3,625 | $17,784 | $5,506 | $12,278 |
| 2017 | $3,581 | $17,568 | $5,827 | $11,741 |
| 2016 | $3,423 | $17,125 | $6,820 | $10,305 |
| 2015 | $1,999 | $16,156 | $7,368 | $8,788 |
| 2014 | $1,999 | $15,709 | $7,164 | $8,545 |
Source: Public Records
Map
Nearby Homes
- 659 Miller Ave
- 680 Hendrix St
- 591 van Siclen Ave
- 587 van Siclen Ave
- 582 van Siclen Ave Unit 2
- 514 New Lots Ave
- 760 Livonia Ave
- 743 Hendrix St
- 637 Hendrix St
- 701 van Siclen Ave
- 598 Miller Ave
- 697 Schenck Ave
- 637 Hegeman Ave Unit MXD
- 637 Hegeman Ave
- 816 Dumont Ave
- 651 Vermont St
- 631 Hegeman Ave
- 659 Jerome St
- 694 Jerome St
- 572 Jerome St