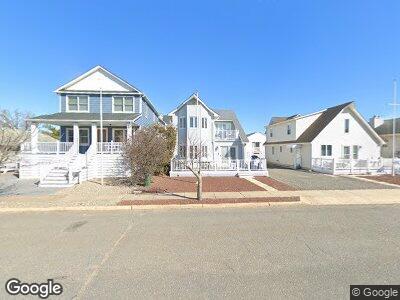
560 Salmon Ave Manasquan, NJ 08736
Manasquan NeighborhoodEstimated Value: $1,312,000 - $1,439,000
4
Beds
2
Baths
1,436
Sq Ft
$964/Sq Ft
Est. Value
About This Home
This home is located at 560 Salmon Ave, Manasquan, NJ 08736 and is currently estimated at $1,384,543, approximately $964 per square foot. 560 Salmon Ave is a home located in Monmouth County with nearby schools including Manasquan Elementary School and Manasquan High School.
Ownership History
Date
Name
Owned For
Owner Type
Purchase Details
Closed on
Jun 27, 2016
Sold by
Robert Dunn
Bought by
Forst George and Forst Jennifer
Current Estimated Value
Home Financials for this Owner
Home Financials are based on the most recent Mortgage that was taken out on this home.
Original Mortgage
$417,000
Outstanding Balance
$338,900
Interest Rate
3.56%
Estimated Equity
$1,045,643
Purchase Details
Closed on
Jun 8, 2016
Sold by
Dunn Robert and Dunn Nancy
Bought by
Forst George F and Forst Jennifer J
Home Financials for this Owner
Home Financials are based on the most recent Mortgage that was taken out on this home.
Original Mortgage
$417,000
Outstanding Balance
$338,900
Interest Rate
3.56%
Estimated Equity
$1,045,643
Purchase Details
Closed on
Oct 23, 1998
Sold by
Hope James
Bought by
Dunn Robert and Dunn Nancy
Home Financials for this Owner
Home Financials are based on the most recent Mortgage that was taken out on this home.
Original Mortgage
$250,000
Interest Rate
6.83%
Create a Home Valuation Report for This Property
The Home Valuation Report is an in-depth analysis detailing your home's value as well as a comparison with similar homes in the area
Home Values in the Area
Average Home Value in this Area
Purchase History
| Date | Buyer | Sale Price | Title Company |
|---|---|---|---|
| Forst George F | $620,000 | Old Republic Nat'L Title Ins | |
| Dunn Robert | $285,000 | -- |
Source: Public Records
Mortgage History
| Date | Status | Borrower | Loan Amount |
|---|---|---|---|
| Open | Forst George F | $417,000 | |
| Previous Owner | Dunn Robert | $250,000 |
Source: Public Records
Tax History Compared to Growth
Tax History
| Year | Tax Paid | Tax Assessment Tax Assessment Total Assessment is a certain percentage of the fair market value that is determined by local assessors to be the total taxable value of land and additions on the property. | Land | Improvement |
|---|---|---|---|---|
| 2024 | $11,185 | $653,700 | $486,200 | $167,500 |
| 2023 | $11,185 | $653,700 | $486,200 | $167,500 |
| 2022 | $10,766 | $653,700 | $486,200 | $167,500 |
| 2021 | $10,766 | $653,700 | $486,200 | $167,500 |
| 2020 | $10,616 | $653,700 | $486,200 | $167,500 |
| 2019 | $10,217 | $653,700 | $486,200 | $167,500 |
| 2018 | $9,989 | $653,700 | $486,200 | $167,500 |
| 2017 | $9,609 | $653,700 | $486,200 | $167,500 |
| 2016 | $9,354 | $653,700 | $486,200 | $167,500 |
| 2015 | $6,836 | $400,000 | $270,000 | $130,000 |
| 2014 | $7,682 | $450,000 | $320,000 | $130,000 |
Source: Public Records
Map
Nearby Homes
- 17 Captains Ct
- 119 1st Ave
- 106 1st Ave
- 22 Crescent Dr
- 109 Boardwalk
- 115 Boardwalk
- 504 Green Ave
- 2 Beachcomber Ln
- 140 Ocean Ave
- 131 Randall Ave Unit 1 and 2
- 66 N Potter Ave
- 133 Randall Ave Unit 4
- 316 Woodland Ave
- 354 Euclid Ave Unit 354 1/2
- 103 River Mist Way Unit C16
- 105 Chicago Ave
- 501 Leslie Ave
- 1A Water St
- 329 Fisk Ave
- 207 Yale Ave