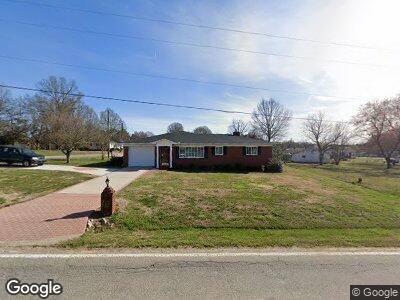
5611 Wright Rd Unit L 1-4 Kannapolis, NC 28081
Estimated Value: $303,194 - $339,000
2
Beds
2
Baths
1,364
Sq Ft
$239/Sq Ft
Est. Value
About This Home
This home is located at 5611 Wright Rd Unit L 1-4, Kannapolis, NC 28081 and is currently estimated at $326,049, approximately $239 per square foot. 5611 Wright Rd Unit L 1-4 is a home located in Rowan County with nearby schools including Landis Elementary School, Corriher Lipe Middle School, and South Rowan High School.
Ownership History
Date
Name
Owned For
Owner Type
Purchase Details
Closed on
Oct 27, 2021
Sold by
Kidd Gerald W and Kidd Teresa B
Bought by
Pendlay Albert and Pendlay Kathy K
Current Estimated Value
Home Financials for this Owner
Home Financials are based on the most recent Mortgage that was taken out on this home.
Original Mortgage
$256,971
Outstanding Balance
$238,863
Interest Rate
2.8%
Mortgage Type
VA
Estimated Equity
$66,567
Purchase Details
Closed on
Dec 18, 2019
Sold by
Kidd Ronald E
Bought by
Kidd Gerald W and Kidd Teresa B
Purchase Details
Closed on
Oct 23, 2015
Sold by
Ratliff Roger William and Ratliff Mary Lesa
Bought by
Kidd Ronald E
Purchase Details
Closed on
Sep 24, 2013
Sold by
Ratliff Roger William
Bought by
Ratliff Roger William and Ratliff Mary Lesa
Create a Home Valuation Report for This Property
The Home Valuation Report is an in-depth analysis detailing your home's value as well as a comparison with similar homes in the area
Home Values in the Area
Average Home Value in this Area
Purchase History
| Date | Buyer | Sale Price | Title Company |
|---|---|---|---|
| Pendlay Albert | $279,000 | Statewide Title Inc | |
| Kidd Gerald W | $165,000 | None Available | |
| Kidd Ronald E | $125,000 | None Available | |
| Ratliff Roger William | -- | None Available |
Source: Public Records
Mortgage History
| Date | Status | Borrower | Loan Amount |
|---|---|---|---|
| Open | Pendlay Albert | $256,971 | |
| Previous Owner | Kidd Ronald E | $142,900 |
Source: Public Records
Tax History Compared to Growth
Tax History
| Year | Tax Paid | Tax Assessment Tax Assessment Total Assessment is a certain percentage of the fair market value that is determined by local assessors to be the total taxable value of land and additions on the property. | Land | Improvement |
|---|---|---|---|---|
| 2024 | $1,418 | $214,914 | $30,800 | $184,114 |
| 2023 | $1,418 | $214,914 | $30,800 | $184,114 |
| 2022 | $1,076 | $145,956 | $18,150 | $127,806 |
| 2021 | $1,076 | $145,956 | $18,150 | $127,806 |
| 2020 | $1,076 | $145,956 | $18,150 | $127,806 |
| 2019 | $1,076 | $145,956 | $18,150 | $127,806 |
| 2018 | $754 | $103,086 | $18,150 | $84,936 |
| 2017 | $754 | $103,086 | $18,150 | $84,936 |
| 2016 | $744 | $103,086 | $18,150 | $84,936 |
| 2015 | $756 | $103,086 | $18,150 | $84,936 |
| 2014 | $774 | $107,436 | $18,150 | $89,286 |
Source: Public Records
Map
Nearby Homes
- 290 S Enochville Ave
- 112 Tanglewood Dr
- 110 Tanglewood Dr
- 121 Tanglewood Dr
- 245 Northdale Ave
- 0 Charlie Walker Rd Unit CAR4248836
- 6434 Miller Rd
- 7860 Georgia Ave
- 2126 W C St
- 2124 W C St
- 0 Mcgill St Unit 13&14 CAR4217137
- 6307 Roanoke Dr Unit 17
- 0 Winona Ave
- 5941 Legacy Ln
- 2100 Temple St
- 5933 Legacy Ln
- 108 Arlene Ave
- 516 Spring Garden Ave
- Lot 18 Solitude Ct
- Lot 15 Solitude Ct