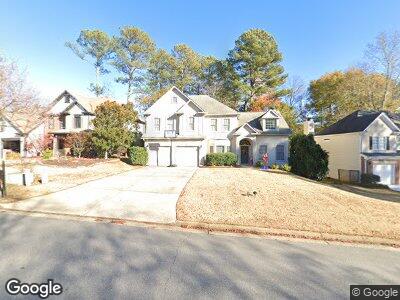
5620 Hillgate Crossing Unit 3 Alpharetta, GA 30005
Ocee NeighborhoodEstimated Value: $596,089 - $623,000
4
Beds
3
Baths
2,095
Sq Ft
$290/Sq Ft
Est. Value
About This Home
This home is located at 5620 Hillgate Crossing Unit 3, Alpharetta, GA 30005 and is currently estimated at $606,522, approximately $289 per square foot. 5620 Hillgate Crossing Unit 3 is a home located in Fulton County with nearby schools including Abbotts Hill Elementary School, Taylor Road Middle School, and Chattahoochee High School.
Ownership History
Date
Name
Owned For
Owner Type
Purchase Details
Closed on
May 31, 2006
Sold by
Potapoff Sergei
Bought by
Potapoff Sergei and Potapoff Flora J
Current Estimated Value
Home Financials for this Owner
Home Financials are based on the most recent Mortgage that was taken out on this home.
Original Mortgage
$204,400
Interest Rate
6.5%
Mortgage Type
New Conventional
Purchase Details
Closed on
Sep 30, 1999
Sold by
Gerber Alan M and Gerber Susan T
Bought by
Barnard John D and Barnard Joann C
Home Financials for this Owner
Home Financials are based on the most recent Mortgage that was taken out on this home.
Original Mortgage
$140,000
Interest Rate
7.85%
Mortgage Type
New Conventional
Create a Home Valuation Report for This Property
The Home Valuation Report is an in-depth analysis detailing your home's value as well as a comparison with similar homes in the area
Home Values in the Area
Average Home Value in this Area
Purchase History
| Date | Buyer | Sale Price | Title Company |
|---|---|---|---|
| Potapoff Sergei | -- | -- | |
| Barnard John D | $190,000 | -- |
Source: Public Records
Mortgage History
| Date | Status | Borrower | Loan Amount |
|---|---|---|---|
| Open | Potapoff Sergel | $258,459 | |
| Closed | Potapoff Sergel | $264,715 | |
| Closed | Potapoff Sergei | $204,400 | |
| Previous Owner | Barnard John D | $140,000 | |
| Previous Owner | Barnard John D | $135,500 | |
| Previous Owner | Barnard John D | $140,000 |
Source: Public Records
Tax History Compared to Growth
Tax History
| Year | Tax Paid | Tax Assessment Tax Assessment Total Assessment is a certain percentage of the fair market value that is determined by local assessors to be the total taxable value of land and additions on the property. | Land | Improvement |
|---|---|---|---|---|
| 2023 | $5,693 | $201,680 | $43,120 | $158,560 |
| 2022 | $3,363 | $170,600 | $39,800 | $130,800 |
| 2021 | $3,317 | $131,760 | $34,720 | $97,040 |
| 2020 | $3,336 | $124,400 | $28,320 | $96,080 |
| 2019 | $393 | $122,200 | $27,800 | $94,400 |
| 2018 | $3,429 | $119,320 | $27,160 | $92,160 |
| 2017 | $3,308 | $109,360 | $28,800 | $80,560 |
| 2016 | $3,242 | $109,040 | $28,800 | $80,240 |
| 2015 | $3,334 | $110,720 | $28,800 | $81,920 |
| 2014 | $2,697 | $89,520 | $23,280 | $66,240 |
Source: Public Records
Map
Nearby Homes
- 11365 Donnington Dr
- 11770 Ashwick Place Unit 1
- 115 Westbury Ln
- 5755 Haterleigh Dr Unit 1
- 415 Chippenham Ct
- 415 Chippenham Ct Unit 2
- 280 Leaf Ct
- 11570 Dunhill Place Dr
- 11245 Parsons Rd
- 11245 Parsons Rd
- 11245 Parsons Rd
- 11245 Parsons Rd
- 11245 Parsons Rd
- 11245 Parsons Rd
- 11245 Parsons Rd
- 245 Davenham Ct
- 615 Arncliffe Ct
- 11255 Knollwood Bend
- 11894 Aspen Forest Dr
- 11335 Bennett Ln