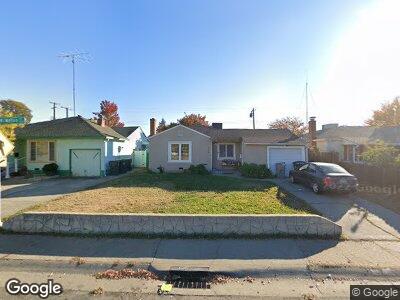
5640 Mcmahon Dr Sacramento, CA 95824
Fruitridge Manor NeighborhoodEstimated Value: $322,564 - $375,000
3
Beds
1
Bath
965
Sq Ft
$356/Sq Ft
Est. Value
About This Home
This home is located at 5640 Mcmahon Dr, Sacramento, CA 95824 and is currently estimated at $343,141, approximately $355 per square foot. 5640 Mcmahon Dr is a home located in Sacramento County with nearby schools including Suy:u Elementary School, Will C. Wood Middle School, and Hiram W. Johnson High School.
Ownership History
Date
Name
Owned For
Owner Type
Purchase Details
Closed on
May 26, 2021
Sold by
Harris Jason S
Bought by
Harris Jason and The Jason Harris Trust
Current Estimated Value
Purchase Details
Closed on
Aug 26, 2008
Sold by
U S Bank Na
Bought by
Harris Jason S
Home Financials for this Owner
Home Financials are based on the most recent Mortgage that was taken out on this home.
Original Mortgage
$47,175
Outstanding Balance
$32,365
Interest Rate
6.51%
Mortgage Type
Purchase Money Mortgage
Estimated Equity
$290,824
Purchase Details
Closed on
May 28, 2008
Sold by
Garcia Adriana Mora
Bought by
U S Bank Na and Jpmac 2006-He1
Purchase Details
Closed on
Nov 9, 2005
Sold by
Derheim Michelle
Bought by
Garcia Adriana Mora
Home Financials for this Owner
Home Financials are based on the most recent Mortgage that was taken out on this home.
Original Mortgage
$53,400
Interest Rate
5.97%
Mortgage Type
Stand Alone Second
Create a Home Valuation Report for This Property
The Home Valuation Report is an in-depth analysis detailing your home's value as well as a comparison with similar homes in the area
Home Values in the Area
Average Home Value in this Area
Purchase History
| Date | Buyer | Sale Price | Title Company |
|---|---|---|---|
| Harris Jason | -- | None Available | |
| Harris Jason S | $63,000 | Fidelity National Title Co | |
| U S Bank Na | $228,937 | Accommodation | |
| Garcia Adriana Mora | $267,000 | Commerce Title Company | |
| Derheim Michelle | -- | Commerce Title Company |
Source: Public Records
Mortgage History
| Date | Status | Borrower | Loan Amount |
|---|---|---|---|
| Open | Harris Jason S | $47,175 | |
| Previous Owner | Derheim Michelle | $53,400 | |
| Previous Owner | Derheim Michelle | $213,600 |
Source: Public Records
Tax History Compared to Growth
Tax History
| Year | Tax Paid | Tax Assessment Tax Assessment Total Assessment is a certain percentage of the fair market value that is determined by local assessors to be the total taxable value of land and additions on the property. | Land | Improvement |
|---|---|---|---|---|
| 2024 | $1,114 | $79,522 | $47,588 | $31,934 |
| 2023 | $1,088 | $77,963 | $46,655 | $31,308 |
| 2022 | $1,068 | $76,436 | $45,741 | $30,695 |
| 2021 | $1,021 | $74,939 | $44,845 | $30,094 |
| 2020 | $1,024 | $74,172 | $44,386 | $29,786 |
| 2019 | $1,004 | $72,718 | $43,516 | $29,202 |
| 2018 | $978 | $71,293 | $42,663 | $28,630 |
| 2017 | $963 | $69,896 | $41,827 | $28,069 |
| 2016 | $940 | $68,526 | $41,007 | $27,519 |
| 2015 | $925 | $67,498 | $40,392 | $27,106 |
| 2014 | $904 | $66,177 | $39,601 | $26,576 |
Source: Public Records
Map
Nearby Homes
- 5940 Lemon Park Way
- 5946 Lemon Park Way
- 5942 Ortega St
- 5270 Mckellar Ave
- 5813 63rd St
- 5532 Fruitridge Rd
- 5661 62nd St
- 5501 59th St
- 6025 Dias Ave
- 5229 Senesta Cir
- 5931 Clover Manor Way
- 5242 Senesta Cir
- 5749 Nina Way
- 5204 El Paraiso Ave
- 5246 Senesta Cir
- 6235 Dias Ave
- 5304 57th St
- 5250 Senesta Cir
- 5264 Senesta Cir
- 5268 Senesta Cir