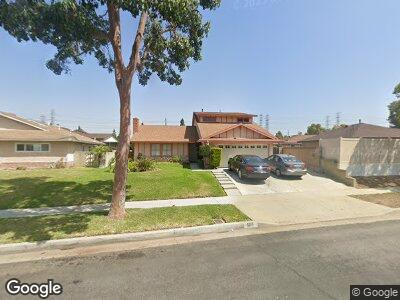
565 E Bradenhall Dr Carson, CA 90746
Estimated Value: $842,000 - $930,000
4
Beds
2
Baths
2,018
Sq Ft
$434/Sq Ft
Est. Value
About This Home
This home is located at 565 E Bradenhall Dr, Carson, CA 90746 and is currently estimated at $876,390, approximately $434 per square foot. 565 E Bradenhall Dr is a home located in Los Angeles County with nearby schools including Ambler Avenue Elementary School, Glenn Hammond Curtiss Middle School, and Gardena Senior High School.
Ownership History
Date
Name
Owned For
Owner Type
Purchase Details
Closed on
Jul 25, 2002
Sold by
Ross Pauline Miller
Bought by
Hunter Roderick
Current Estimated Value
Home Financials for this Owner
Home Financials are based on the most recent Mortgage that was taken out on this home.
Original Mortgage
$193,000
Interest Rate
6.17%
Purchase Details
Closed on
May 16, 1994
Sold by
Ross Huval
Bought by
Ross Pauline Miller
Purchase Details
Closed on
Mar 31, 1994
Sold by
Norris Sonya V
Bought by
Miller Pauline
Purchase Details
Closed on
Mar 30, 1994
Sold by
Norris Michael A
Bought by
Norris Sonya
Purchase Details
Closed on
Mar 3, 1994
Sold by
Williams Robert L and Williams Mary L
Bought by
Norris Sonya
Create a Home Valuation Report for This Property
The Home Valuation Report is an in-depth analysis detailing your home's value as well as a comparison with similar homes in the area
Home Values in the Area
Average Home Value in this Area
Purchase History
| Date | Buyer | Sale Price | Title Company |
|---|---|---|---|
| Hunter Roderick | $272,500 | Landsafe Title | |
| Ross Pauline Miller | -- | South Coast Title | |
| Miller Ross Pauline | -- | South Coast Title | |
| Miller Pauline | -- | -- | |
| Norris Sonya | -- | -- | |
| Norris Sonya | -- | -- |
Source: Public Records
Mortgage History
| Date | Status | Borrower | Loan Amount |
|---|---|---|---|
| Open | Hunter Roderick | $164,196 | |
| Closed | Hunter Roderick | $34,630 | |
| Previous Owner | Hunter Roderick | $193,000 |
Source: Public Records
Tax History Compared to Growth
Tax History
| Year | Tax Paid | Tax Assessment Tax Assessment Total Assessment is a certain percentage of the fair market value that is determined by local assessors to be the total taxable value of land and additions on the property. | Land | Improvement |
|---|---|---|---|---|
| 2024 | $5,488 | $386,910 | $160,300 | $226,610 |
| 2023 | $5,378 | $379,324 | $157,157 | $222,167 |
| 2022 | $5,117 | $371,887 | $154,076 | $217,811 |
| 2021 | $5,048 | $364,596 | $151,055 | $213,541 |
| 2019 | $4,863 | $353,784 | $146,576 | $207,208 |
| 2018 | $4,765 | $346,848 | $143,702 | $203,146 |
| 2016 | $4,553 | $333,381 | $138,123 | $195,258 |
| 2015 | $4,462 | $328,375 | $136,049 | $192,326 |
| 2014 | $4,453 | $321,943 | $133,384 | $188,559 |
Source: Public Records
Map
Nearby Homes
- 17222 Wall St
- 16301 S Tarrant Ave
- 1516 S Visalia Ave
- 17700 S Avalon Blvd Unit 225
- 17406 Sandlake Ave
- 825 E Claude St
- 720 E Acoma Dr
- 2709 W Billings St
- 16213 Mckinley Ave
- 2634 W Billings St
- 16214 Mckinley Ave
- 15811 S Tarrant Ave
- 17700 Avalon Blvd Unit 387
- 17700 Avalon Blvd Unit 98
- 552 E Newfield St
- 854 E Meadbrook St
- 17539 Persimmon Dr
- 803 E Victoria St Unit 116
- 15705 Deblynn Ave
- 1006 S Caswell Ave