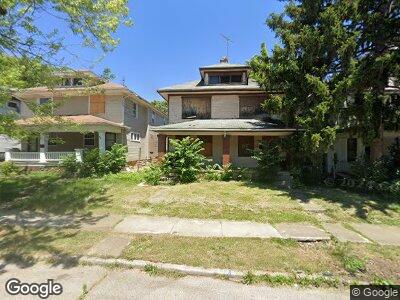
57 Marathon Ave Dayton, OH 45405
Santa Clara NeighborhoodEstimated Value: $60,000 - $120,000
5
Beds
3
Baths
2,336
Sq Ft
$40/Sq Ft
Est. Value
About This Home
This home is located at 57 Marathon Ave, Dayton, OH 45405 and is currently estimated at $92,677, approximately $39 per square foot. 57 Marathon Ave is a home located in Montgomery County with nearby schools including Valerie Elementary School, Deca Prep, and Dayton Leadership Academies.
Ownership History
Date
Name
Owned For
Owner Type
Purchase Details
Closed on
Oct 23, 2023
Sold by
Williams Crystal
Bought by
Javaani Properties Llc
Current Estimated Value
Home Financials for this Owner
Home Financials are based on the most recent Mortgage that was taken out on this home.
Original Mortgage
$79,000
Outstanding Balance
$78,047
Interest Rate
7.31%
Mortgage Type
Credit Line Revolving
Estimated Equity
$3,215
Purchase Details
Closed on
Sep 3, 2014
Sold by
Martin Goss Ltd
Bought by
Williams Crystal
Purchase Details
Closed on
Jan 1, 2004
Sold by
Crane Brent A and Crane Patricia M
Bought by
Crane Development Co Ltd
Purchase Details
Closed on
Jan 3, 2003
Sold by
Whallon Daniel D
Bought by
Crane Brent A and Crane Patricia M
Home Financials for this Owner
Home Financials are based on the most recent Mortgage that was taken out on this home.
Original Mortgage
$56,610
Interest Rate
6.37%
Mortgage Type
Purchase Money Mortgage
Create a Home Valuation Report for This Property
The Home Valuation Report is an in-depth analysis detailing your home's value as well as a comparison with similar homes in the area
Home Values in the Area
Average Home Value in this Area
Purchase History
| Date | Buyer | Sale Price | Title Company |
|---|---|---|---|
| Javaani Properties Llc | $16,000 | None Listed On Document | |
| Crane Development Co Ltd | -- | -- | |
| Crane Brent A | $62,900 | -- |
Source: Public Records
Mortgage History
| Date | Status | Borrower | Loan Amount |
|---|---|---|---|
| Open | Javaani Properties Llc | $79,000 | |
| Previous Owner | Crane Brent A | $57,200 | |
| Previous Owner | Crane Brent A | $56,610 |
Source: Public Records
Tax History Compared to Growth
Tax History
| Year | Tax Paid | Tax Assessment Tax Assessment Total Assessment is a certain percentage of the fair market value that is determined by local assessors to be the total taxable value of land and additions on the property. | Land | Improvement |
|---|---|---|---|---|
| 2024 | $422 | $6,170 | $3,560 | $2,610 |
| 2023 | $422 | $6,170 | $3,560 | $2,610 |
| 2022 | $1,167 | $5,270 | $3,040 | $2,230 |
| 2021 | $693 | $5,270 | $3,040 | $2,230 |
| 2020 | $1,140 | $5,270 | $3,040 | $2,230 |
| 2019 | $1,339 | $15,380 | $2,430 | $12,950 |
| 2018 | $2,518 | $15,380 | $2,430 | $12,950 |
| 2017 | $2,148 | $15,380 | $2,430 | $12,950 |
| 2016 | $2,032 | $15,990 | $3,040 | $12,950 |
| 2015 | $1,400 | $15,990 | $3,040 | $12,950 |
| 2014 | $1,400 | $15,990 | $3,040 | $12,950 |
| 2012 | -- | $17,810 | $3,780 | $14,030 |
Source: Public Records
Map
Nearby Homes
- 27 Santa Clara Ave
- 121 Santa Clara Ave
- 113 Niagara Ave
- 105 Elmwood Ave E
- 138 Santa Clara Ave
- 23 W Norman Ave
- 127 Iroquois Ave
- 123 Delaware Ave
- 166 Niagara Ave
- 46 Glenwood Ave Unit 46 48
- 710 Rockford Ave Unit 704
- 2312 Parkland Ave
- 136 E Hudson Ave
- 244 Delaware Ave Unit 242
- 225 Victor Ave
- 111 E Norman Ave
- 42 Mary Ave
- 237 Victor Ave
- 611 Rockford Ave
- 311 Marathon Ave