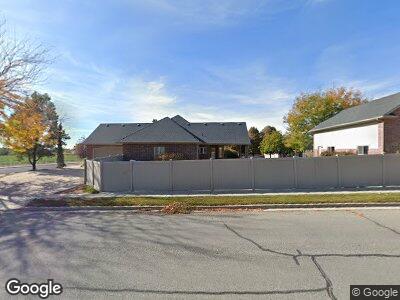
571 N 2575 W West Point, UT 84015
Estimated Value: $676,000 - $900,028
--
Bed
5
Baths
2,378
Sq Ft
$334/Sq Ft
Est. Value
About This Home
This home is located at 571 N 2575 W, West Point, UT 84015 and is currently estimated at $794,507, approximately $334 per square foot. 571 N 2575 W is a home located in Davis County with nearby schools including Lakeside School, West Point Junior High School, and Syracuse High School.
Ownership History
Date
Name
Owned For
Owner Type
Purchase Details
Closed on
Dec 16, 2020
Sold by
Dabling Riley and Dabling Shannon
Bought by
Dabling Shannon P and Twelve Twenty One Irrevocable
Current Estimated Value
Purchase Details
Closed on
Nov 6, 2019
Sold by
Craythorne Erik Richard and Craythorne Jil M
Bought by
Dabling Riley and Dabling Shannon
Home Financials for this Owner
Home Financials are based on the most recent Mortgage that was taken out on this home.
Original Mortgage
$150,000
Outstanding Balance
$85,435
Interest Rate
3.6%
Mortgage Type
Unknown
Estimated Equity
$714,296
Purchase Details
Closed on
Oct 21, 2003
Sold by
Craythorne Construction Co Inc
Bought by
Craythorne Erik Richard and Craythorne Jil M
Home Financials for this Owner
Home Financials are based on the most recent Mortgage that was taken out on this home.
Original Mortgage
$127,200
Interest Rate
4.62%
Mortgage Type
Purchase Money Mortgage
Create a Home Valuation Report for This Property
The Home Valuation Report is an in-depth analysis detailing your home's value as well as a comparison with similar homes in the area
Home Values in the Area
Average Home Value in this Area
Purchase History
| Date | Buyer | Sale Price | Title Company |
|---|---|---|---|
| Dabling Shannon P | -- | None Available | |
| Dabling Riley | -- | Stewart Title Ins Agency | |
| Craythorne Erik Richard | -- | Bonneville Title Company Inc |
Source: Public Records
Mortgage History
| Date | Status | Borrower | Loan Amount |
|---|---|---|---|
| Open | Dabling Riley | $50,000 | |
| Open | Dabling Riley | $150,000 | |
| Previous Owner | Craythorne Erik Richard | $20,000 | |
| Previous Owner | Craythorne Erik Richard | $127,200 |
Source: Public Records
Tax History Compared to Growth
Tax History
| Year | Tax Paid | Tax Assessment Tax Assessment Total Assessment is a certain percentage of the fair market value that is determined by local assessors to be the total taxable value of land and additions on the property. | Land | Improvement |
|---|---|---|---|---|
| 2024 | $4,920 | $463,100 | $132,153 | $330,947 |
| 2023 | $4,632 | $802,000 | $179,675 | $622,325 |
| 2022 | $5,107 | $484,000 | $97,915 | $386,085 |
| 2021 | $4,697 | $666,000 | $136,299 | $529,701 |
| 2020 | $4,181 | $585,000 | $117,411 | $467,589 |
| 2019 | $4,124 | $569,000 | $113,037 | $455,963 |
| 2018 | $3,787 | $515,000 | $106,801 | $408,199 |
| 2016 | $3,511 | $251,240 | $48,216 | $203,024 |
| 2015 | $3,590 | $243,430 | $48,216 | $195,214 |
| 2014 | $3,150 | $216,566 | $48,216 | $168,350 |
| 2013 | -- | $174,486 | $52,707 | $121,779 |
Source: Public Records