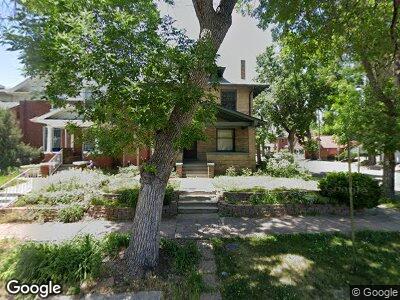
571 N Emerson St Unit A Denver, CO 80218
Alamo Placita NeighborhoodEstimated Value: $816,424 - $903,000
4
Beds
1
Bath
1,536
Sq Ft
$571/Sq Ft
Est. Value
About This Home
This home is located at 571 N Emerson St Unit A, Denver, CO 80218 and is currently estimated at $877,606, approximately $571 per square foot. 571 N Emerson St Unit A is a home located in Denver County with nearby schools including Dora Moore ECE-8 School, Morey Middle School, and East High School.
Ownership History
Date
Name
Owned For
Owner Type
Purchase Details
Closed on
May 20, 2024
Sold by
Sjoden Margaret A and Anderson Jeffrey
Bought by
Rylander Erik and Lujan Violeta
Current Estimated Value
Home Financials for this Owner
Home Financials are based on the most recent Mortgage that was taken out on this home.
Original Mortgage
$468,000
Outstanding Balance
$463,922
Interest Rate
6.82%
Mortgage Type
New Conventional
Estimated Equity
$415,224
Purchase Details
Closed on
Mar 26, 2003
Sold by
Sjoden Margaret A
Bought by
Sjoden Margaret A and Anderson Jeffrey
Home Financials for this Owner
Home Financials are based on the most recent Mortgage that was taken out on this home.
Original Mortgage
$187,700
Interest Rate
5.57%
Mortgage Type
Purchase Money Mortgage
Create a Home Valuation Report for This Property
The Home Valuation Report is an in-depth analysis detailing your home's value as well as a comparison with similar homes in the area
Home Values in the Area
Average Home Value in this Area
Purchase History
| Date | Buyer | Sale Price | Title Company |
|---|---|---|---|
| Rylander Erik | $906,000 | Stewart Title | |
| Sjoden Margaret A | -- | Chicago Title Co |
Source: Public Records
Mortgage History
| Date | Status | Borrower | Loan Amount |
|---|---|---|---|
| Open | Rylander Erik | $468,000 | |
| Previous Owner | Sjoden Margaret A | $187,700 | |
| Previous Owner | Sjoden Margaret A | $198,400 | |
| Closed | Sjoden Margaret A | $104,200 |
Source: Public Records
Tax History Compared to Growth
Tax History
| Year | Tax Paid | Tax Assessment Tax Assessment Total Assessment is a certain percentage of the fair market value that is determined by local assessors to be the total taxable value of land and additions on the property. | Land | Improvement |
|---|---|---|---|---|
| 2024 | $3,741 | $47,240 | $11,470 | $35,770 |
| 2023 | $3,660 | $47,240 | $11,470 | $35,770 |
| 2022 | $3,479 | $43,750 | $15,720 | $28,030 |
| 2021 | $3,359 | $45,010 | $16,170 | $28,840 |
| 2020 | $2,985 | $40,230 | $14,700 | $25,530 |
| 2019 | $2,901 | $40,230 | $14,700 | $25,530 |
| 2018 | $2,643 | $34,160 | $13,320 | $20,840 |
| 2017 | $2,635 | $34,160 | $13,320 | $20,840 |
| 2016 | $2,422 | $29,700 | $12,274 | $17,426 |
| 2015 | $2,320 | $29,700 | $12,274 | $17,426 |
| 2014 | $2,090 | $25,170 | $9,027 | $16,143 |
Source: Public Records
Map
Nearby Homes
- 529 N Washington St Unit 304
- 930 E 7th Ave
- 433 N Ogden St
- 432 N Ogden St
- 669 N Washington St Unit 901
- 551 N Pearl St Unit 207
- 525 N Pearl St
- 440 N Pearl St
- 700 N Washington St Unit 1104
- 700 N Washington St Unit 502
- 728 N Ogden St
- 655 N Pearl St Unit 301
- 655 N Pearl St Unit 208
- 655 N Pearl St Unit 108
- 570 N Downing St
- 611 E 7th Ave Unit 108
- 562 N Pennsylvania St
- 449 N Pearl St
- 534 E 7th Ave Unit 107
- 534 E 7th Ave Unit 206