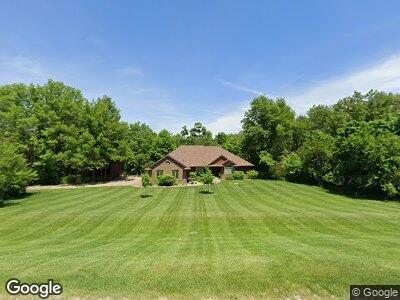
5738 Tower Terrace Rd Cedar Rapids, IA 52411
Estimated Value: $470,000 - $579,000
3
Beds
5
Baths
2,194
Sq Ft
$248/Sq Ft
Est. Value
About This Home
This home is located at 5738 Tower Terrace Rd, Cedar Rapids, IA 52411 and is currently estimated at $544,653, approximately $248 per square foot. 5738 Tower Terrace Rd is a home located in Linn County with nearby schools including Hiawatha Elementary School, Harding Middle School, and John F. Kennedy High School.
Ownership History
Date
Name
Owned For
Owner Type
Purchase Details
Closed on
Aug 10, 2023
Sold by
Sheriff Of Linn County
Bought by
Northwoods Holdings Llc and Williams
Current Estimated Value
Purchase Details
Closed on
Aug 30, 2022
Sold by
Sheriff Of Linn County
Bought by
Northwoods Holdings Llc and Capital One Bank Usa Na
Home Financials for this Owner
Home Financials are based on the most recent Mortgage that was taken out on this home.
Original Mortgage
$0
Interest Rate
5.22%
Mortgage Type
New Conventional
Purchase Details
Closed on
Jan 6, 2022
Sold by
Jones David E and Jones Linda K
Bought by
North Woods Holdings Llc
Home Financials for this Owner
Home Financials are based on the most recent Mortgage that was taken out on this home.
Original Mortgage
$0
Interest Rate
3.92%
Mortgage Type
New Conventional
Create a Home Valuation Report for This Property
The Home Valuation Report is an in-depth analysis detailing your home's value as well as a comparison with similar homes in the area
Home Values in the Area
Average Home Value in this Area
Purchase History
| Date | Buyer | Sale Price | Title Company |
|---|---|---|---|
| Northwoods Holdings Llc | $60,891 | None Listed On Document | |
| Northwoods Holdings Llc | $82,519 | None Listed On Document | |
| North Woods Holdings Llc | $351,498 | None Available |
Source: Public Records
Mortgage History
| Date | Status | Borrower | Loan Amount |
|---|---|---|---|
| Previous Owner | Northwoods Holdings Llc | $0 | |
| Previous Owner | Northwoods Holdings Llc | $0 | |
| Previous Owner | Jones David E | $283,200 | |
| Previous Owner | Jones David E | $105,025 |
Source: Public Records
Tax History Compared to Growth
Tax History
| Year | Tax Paid | Tax Assessment Tax Assessment Total Assessment is a certain percentage of the fair market value that is determined by local assessors to be the total taxable value of land and additions on the property. | Land | Improvement |
|---|---|---|---|---|
| 2023 | $5,980 | $537,500 | $112,000 | $425,500 |
| 2022 | $5,784 | $423,100 | $112,000 | $311,100 |
| 2021 | $5,972 | $423,100 | $112,000 | $311,100 |
| 2020 | $5,972 | $404,000 | $85,800 | $318,200 |
| 2019 | $5,442 | $376,500 | $85,800 | $290,700 |
| 2018 | $5,324 | $376,500 | $85,800 | $290,700 |
| 2017 | $5,321 | $360,600 | $85,800 | $274,800 |
| 2016 | $5,321 | $360,600 | $85,800 | $274,800 |
| 2015 | $5,355 | $360,600 | $85,800 | $274,800 |
| 2014 | $5,226 | $360,600 | $85,800 | $274,800 |
| 2013 | $5,120 | $360,600 | $85,800 | $274,800 |
Source: Public Records
Map
Nearby Homes
- 3015 Prairielight Ct
- 3012 Prairielight Ct
- 2327 Springbrook Dr
- 3003 Prairielight Ct
- 2881 Meadow Ct
- 2853 Prairielight Dr
- 2854 Mary Green Rd
- 2849 Prairielight Dr
- 2856 Mary Green Rd
- 2858 Mary Green Rd
- 2860 Mary Green Rd
- 2857 Mary Green Rd
- 2859 Mary Green Rd
- 2832 Prairie Wind Ct
- 2861 Mary Green Rd
- 5000 Hunt Rd
- 2817 Prairielight Dr
- 2729 Prairielight Dr
- 3534 Reed Rd
- 2806 Mary Dr