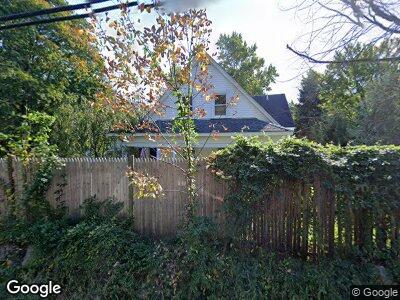
574 Foundry St South Easton, MA 02375
Estimated Value: $630,000 - $674,000
3
Beds
2
Baths
2,009
Sq Ft
$330/Sq Ft
Est. Value
About This Home
This home is located at 574 Foundry St, South Easton, MA 02375 and is currently estimated at $662,817, approximately $329 per square foot. 574 Foundry St is a home located in Bristol County with nearby schools including Easton Middle School, Oliver Ames High School, and St Mary's Catholic School.
Ownership History
Date
Name
Owned For
Owner Type
Purchase Details
Closed on
Jan 27, 2010
Sold by
Fnma
Bought by
Michaud Julie Susan
Current Estimated Value
Home Financials for this Owner
Home Financials are based on the most recent Mortgage that was taken out on this home.
Original Mortgage
$237,650
Interest Rate
4.95%
Mortgage Type
Purchase Money Mortgage
Purchase Details
Closed on
May 19, 2005
Sold by
Madigan James and Madigan Evelyn
Bought by
Walsh James
Home Financials for this Owner
Home Financials are based on the most recent Mortgage that was taken out on this home.
Original Mortgage
$352,000
Interest Rate
5.95%
Mortgage Type
Purchase Money Mortgage
Purchase Details
Closed on
Oct 14, 1994
Sold by
Ribero Celeste D
Bought by
Odonnell Kerry D and Odonnell Evelyn
Create a Home Valuation Report for This Property
The Home Valuation Report is an in-depth analysis detailing your home's value as well as a comparison with similar homes in the area
Home Values in the Area
Average Home Value in this Area
Purchase History
| Date | Buyer | Sale Price | Title Company |
|---|---|---|---|
| Michaud Julie Susan | $215,000 | -- | |
| Michaud Julie Susan | $215,000 | -- | |
| Walsh James | $525,000 | -- | |
| Walsh James | $525,000 | -- | |
| Odonnell Kerry D | $167,000 | -- | |
| Odonnell Kerry D | $167,000 | -- |
Source: Public Records
Mortgage History
| Date | Status | Borrower | Loan Amount |
|---|---|---|---|
| Open | Ohlson Eric R | $588,000 | |
| Closed | Harrison Julie | $195,000 | |
| Closed | Michaud Julie Susan | $237,650 | |
| Previous Owner | Walsh James | $352,000 | |
| Previous Owner | Walsh James | $44,000 | |
| Previous Owner | Odonnell Kerry D | $131,700 |
Source: Public Records
Tax History Compared to Growth
Tax History
| Year | Tax Paid | Tax Assessment Tax Assessment Total Assessment is a certain percentage of the fair market value that is determined by local assessors to be the total taxable value of land and additions on the property. | Land | Improvement |
|---|---|---|---|---|
| 2025 | $6,319 | $506,300 | $288,000 | $218,300 |
| 2024 | $5,970 | $447,200 | $250,700 | $196,500 |
| 2023 | $5,495 | $376,600 | $250,700 | $125,900 |
| 2022 | $5,136 | $333,700 | $210,000 | $123,700 |
| 2021 | $4,946 | $319,500 | $195,800 | $123,700 |
| 2020 | $4,792 | $311,600 | $187,900 | $123,700 |
| 2019 | $4,825 | $302,300 | $181,700 | $120,600 |
| 2018 | $4,620 | $285,000 | $171,900 | $113,100 |
| 2017 | $4,623 | $285,000 | $171,900 | $113,100 |
| 2016 | $4,511 | $278,600 | $166,100 | $112,500 |
| 2015 | $4,255 | $253,600 | $142,300 | $111,300 |
| 2014 | $4,099 | $246,200 | $136,000 | $110,200 |
Source: Public Records
Map
Nearby Homes
- 555 Foundry St Unit B
- 555 Foundry St
- 47 Guinevere Rd
- 37 Matthew Cir
- 30 Rollins Rd
- 15 Guinevere Rd
- 11 Highland St
- 0 Matthew Cir Unit 73312701
- 55 Eastman St
- 379 Bay Rd
- 10 Matthew Cir
- 9 Erin Place
- 19 Forest Edge Rd
- 464 Bay Rd
- 40 Shannon Marie Way
- 15 Coach Rd
- 7 Coach Rd
- 20 Coach Rd
- 19 Tanglewood Dr
- 157 Highland St